BA 1320 light workkkk
 Call Kai
 Learn
Learn Practice Test
 Spaced Repetition
 Match
Match Flashcards
 Knowt Play
1/168

There's no tags or description
Looks like no tags are added yet.
Name | Mastery | Learn | Test | Matching | Spaced | Call with Kai | Chat |
|---|
No analytics yet
Send a link to your students to track their progress
169 Terms
The Big Players
A world in transition.
In the 19th century, the global economy
was dominated by Europe.
Today, the center of global economic
activity is shifting eastward, toward
Asia and emerging economies.
Economic power is becoming more
global and more diverse
In 1870, the world economy was led mainly by European economies:
United Kingdom, Germany and France.
The United Kingdom was the world’s:
• Leading industrial power
• Leading trading nation
• Leading financial center
At its height, the British Empire became the largest empire in
history.
• It is often described as: “The empire on which the sun never sets”
• Because Britain controlled territories on every continent.
20th Century - The Fall of the British Empire
Empires fall fast…
Although the British Empire reached its largest territorial size after World War I, its economic and political dominance declined quickly.
By the end of World War II:
• Britain had given up most of its colonies
• Britain was no longer the world’s leading industrial power
• Britain was no longer the world’s leading military power
The global leadership role was beginning to shift away from Britain to the U.S.
Post WW2 – US Hegemony (part 1)
Before the 1920s, the U.S was still an emerging economic power.
• Until 1920, the majority of Americans lived in rural areas.
• By the 1930s, the U.S. had already become the largest industrial economy in the world.
WW2 marked the turning point
• Western Europe declined economically due to the war.
• The U.S. was the only major economy to emerge from the war intact and strengthened.
• The U.S. became the world’s leading economic and military power.
Post WW2 – US Hegemony Contd. (part 2)
As the main winner of WW2, the U.S. was in a unique position to shape the post-war global order.
The Bretton Woods system
• Creation of institutions coordinating the global economy and the financial system:
• IMF
• World Bank
• GATT (later the WTO)
• The U.S. Dollar became the anchor of the international monetary system and the main global reserve currency In political science, the 20th century is often called the “American Century.”
Japan after WW2
At the end of WW2, Japan was in ruins.
Japan faced a deep economic and social crisis.
• Most large cities (except Kyoto) were heavily damaged
• Industrial facilities and transport networks were destroyed.
• Severe food shortages continued for several years
But in 1968 Japan becomes the second-largest economy in the world.
Japan’s Rapid Recovery and Industrial Growth
The Japanese economy recovered very quickly in the 1950s and 1960s.
Japan emerged as a major center of heavy and manufacturing industries, especially:
• Steel
• Shipbuilding
• Machinery
• chemicals
By 1968, Japan became the world’s second- largest economy (after the United States).
• Experienced one of the strongest examples of a post-war economic recovery and successful industrial transformation.
Japan - From Heavy Industry to High Technology
The 1973 oil crisis strongly hit the Japanese economy.
• Highly dependent on imported energy.
The response was a strategic shift toward high- technology and high value-added industries.
In the 1980s, Japan became a leading economic and technological power.
• Electronics (e.g. Sony – TVs, video and audio equipment)
• Automobile industry (e.g. Toyota, Subaru)
The very rapid post WW2 economic growth in Japan is known as “The Japanese Miracle.
“Japanese Threat”
In the 1980s, the U.S. and other advanced economies increasingly viewed Japan as a major competitive threat.
The U.S. government, under President Reagan,
pressured Japan to limit its exports to the U.S.
• Threat of imposing tariffs on Japanese exports.
Japan agreed to a Voluntary Export Restraint (VER) on automobile exports to the United States.
• Under the VER, Japan restricted the number of cars exported to the U.S.
• The VER encouraged Japanese firms to shift production to the U.S. (Toyota, Honda, etc.)
The End of the “Japanese Miracle”
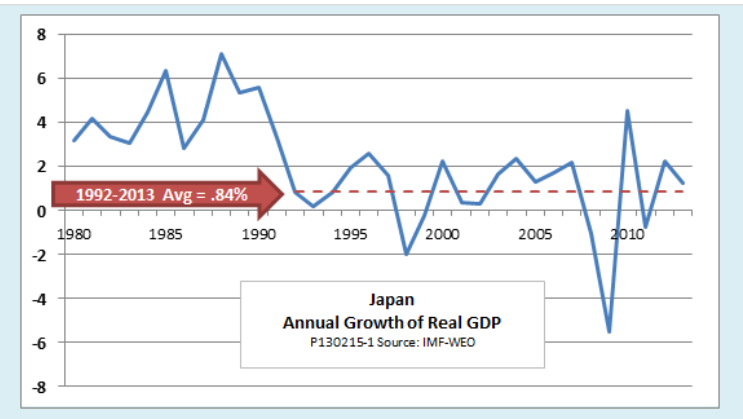
Japan’s economic miracle ended in 1989 with the bursting of the stock market and real estate bubbles.
This collapse triggered 3 decades of very low economic growth.
While Japan remained a wealthy and technologically advanced economy, Japan’s influence in the world economy gradually declined.
Japan Gradual decline:
• 2010, China: Overtook Japan to become the second-largest economy by nominal GDP after the US.
• Early 2024, Germany: Overtook Japan to become the world’s third-largest economy, pushing Japan into fourth place (behind the U.S., China, and Germany).
• 2025, India: Rapidly expanding economy grew larger than Japan’s nominal GDP, making India the fourth-largest economy in the world.
2040 Forecast : A New Economic and Political Order
A Historic Shift in Global Economic Leadership
Over the past 30 years, the global economy has transformed:
• From a Europe/developed-centered world (with the U.S., Germany, UK, Japan dominating) to a world where emerging economies drive growth and scale.
• China is forecasted to become the biggest economy, and India the 3rd largest.
Note: Nominal GDP ≠ GDP per capita
• Total GDP shows power and scale, while GDP per capita shows living standards.
• China and India’s total GDP is massive, but average income per person still remains substantially lower than in advanced economies.

Overview of World Population as of 2025
8.2 Billion people
• India –1.46 billion
• China – 1.41 billion
• USA – 347 million
• Euro Zone - 342 million
• Indonesia – 286 million
• Pakistan – 255 million
• Nigeria – 237 million
• Brazil – 213 million
The World Population – Distribution
Most of the world’s population increase since
the 1950s occurred in developing or emerging
economies.
• Improvements in health and reductions in
mortality drove rapid growth in many countries in
Asia, Africa, and Latin America, while birth rates
in developed regions declined earlier and more
sharply.
As of 2026, large majority of the world —
roughly 85% — lives in developing or emerging
economies, with only about 15% living in
developed economies.
• Roughly 36% of the population in China and
India.

Demographic Forecast
In 1950, population concentrated in Asia (55% of world
population) and Europe (~ 20% of world population).
By 2100, only 11% of the global population will live in North
America, Europe, or Oceania combined.
The vast majority of future population growth will occur in
Africa.
• Africa currently holds ~ 16% of the world population.
• By 2100, Africa is projected to have ~4.4 billion people
(~ 39% of world population) — close to Asia’s share
(44%).
By the end of 21st century most of the World population will
live in Asia and Africa.

The Aging of the Population
World population is also aging.
Due to:
• Increase in life expectancy.
• Decrease in women fertility
rates.

Why Is Aging an Economic Problem?
Shrinking working-age populations
• Fewer workers relative to retirees → labor shortages.
• Who will work? Who will produce?
• Weaker growth in labor supply → firms face higher wage pressure and higher production costs.
Slower potential economic growth
• Long-run growth falls when labor force growth declines.
• Aging societies tend to have lower entrepreneurship and risk-taking.
• Public resources shift from investment (education, infrastructure, innovation) toward age-related
spending.
Rising pension and healthcare costs
• Larger elderly population → higher public spending on pensions, long-term care and health
services
• Growing fiscal pressure on governments → higher taxes, higher public debt, or spending cuts
elsewhere.
• Intergenerational tensions as a smaller workforce finances a larger retired population.
Aging by Region (+Forecast)
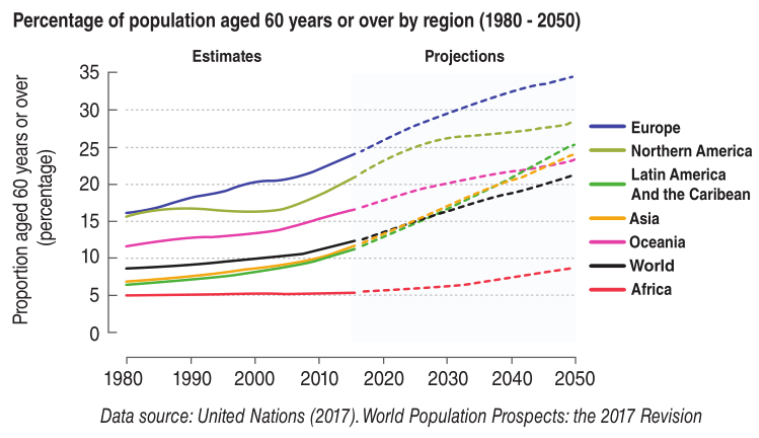
Population aging is a global
phenomenon, but it is happening
much faster in Europe and North
America.
Asia and Latin America are also aging.
But overall, they remain younger than
Europe and North America
Africa, is the youngest region in the
world.
Demographic Trends and Forecast – Takeaways
1. Future population growth will be concentrated mainly in Africa, while population growth
in Europe, North America and East Asia will remain weak or turn negative.
2. Population aging is a global phenomenon, but it is much more severe in advanced
economies, especially in Europe and North America.
3. Africa is the youngest region in the world, with a rapidly expanding working-age
population.
• This creates strong potential for faster long-run growth — if education, jobs and
institutions improve.
4. Demographics are becoming one of the major drivers of global economic change.—
away from today’s aging industrial economies and toward younger, faster-growing
regions, especially Africa and parts of Asia (for example India).
Case Study: Japan
Japan's population began to decline in
2011.
• Population is expected to shrink to 97
million (24%) by 2050, should the
current demographic trend continue.
But Japan’s real problem is aging.
Japan’s Aging Problem
Ratio of people aged 65 and above has
risen dramatically over the last decades.
By 2050 almost 40% of the population will be
above 65.
Due to:
• High life expectancy – one of the highest in
the world
• Low fertility rate – around 1.15 (2024), one
of the lowest in the world
• Substantially lower than the rate of
substitution.

Possible Policy Responses to the Age Crisis
Possible Policy responses to demographic decline
include:
1. Government policies to boost fertility
• Policies include child allowances, subsidized childcare,
parental leave, and housing support.
2. Immigration
3. Technology and automation
• Automation and AI can partly offset labor shortages and
raise productivity.
Japan’s Population Crisis – Solution 1
Japan illustrates the limits of all three policy responses:
1. Government policies to boost fertility
• Policies include child allowances, subsidized childcare,
parental leave, and housing support.
• In practice, these policies have only limited effects on
birth rates.
• Japan faces many barriers:
• Long and inflexible working hours
• High career penalties for women after childbirth
• Persistent gender norms in childcare and household
work
• Result: even generous family policies have not
reversed low fertility.
Japan’s Population Crisis – Solution 2
Japan illustrates the limits of all three policy responses:
2. Immigration
• Immigration is one of the most effective tools to
stabilize the workforce in aging societies.
• For Japan, this solution is particularly difficult:
• Strong social and political resistance to large-
scale immigration
• Result: Compared to Europe or North America,
Japan has very limited scope to rely on
foreign workers.
Japan’s Population Crisis – Solution 3
Japan illustrates the limits of all three policy responses:
3. Technology and automation
• Automation and AI can partly offset labor shortages
and raise productivity.
• Japan is a global leader in robotics and automation.
• However: many growing sectors (health care, elderly
care, services) are difficult to automate.
• Result: Technology cannot fully replace the scale
of labor lost through population decline.
Germany’s Solution
Germany, Europe’s largest industrial economy, faces
pronounced population aging and a shrinking workforce.
Unlike Japan, Germany has admitted large numbers
of immigrants and refugees to help offset labor
shortfalls and support its economy.
Despite economic needs, immigration has become
politically contentious in Germany.
This tension reflects a broader trade-off:
• Economic dependency on immigration vs.
political resistance to it.
Economic Growth Over the Centuries
Economic growth is a new phenomenon.
For most human history until around 1800,
world output is very low and almost flat.
During the 20th century, especially after 1950,
GDP rises extremely fast

World Trade Over the Centuries
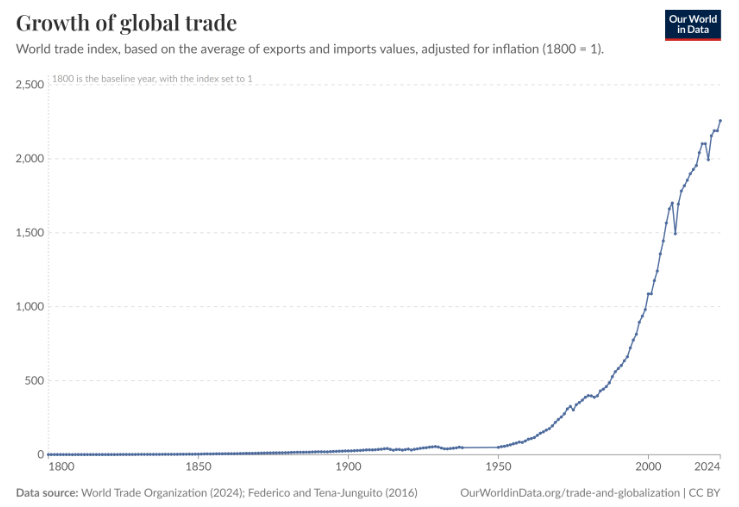
World trade has grown dramatically
since around 1850.
• Slow and steady growth until mid-20th
century.
Rapid acceleration after 1950, especially
post-1980s.
• Temporary dips visible around global
crises (e.g.,2008 financial crisis, COVID-
19)
Four Industrial Revolutions

First Industrial Revolution:
Late 18th to Late 19th Century
Catalyst of the first Industrial Revolution:
• Steam Engine
Historical Impact:
• Fueled the British Industrial Revolution.
• Enabled Great Britain to dominate global trade (British
Empire).
Economic Transformations:
• Machine power substantially enhances human labor→
significant economic growth.
• Railways transported goods over long distances →
Accelerated globalization and international trade.
Second Industrial Revolution:
Late 19th Century to Mid 20th Century
While the First Industrial Revolution gave us machine power, the Second
Industrial Revolution made production scalable, standardized, mobile, and
connected, through several major inventions:
Electricity & Power
• Widespread use of electricity → powered factories, street lighting, and homes
Materials and industrial production
• Modern steel production (Bessemer process)
• Steel became much cheaper
• Enabled railways, bridges, skyscrapers and heavy machinery
• Standardization and mass production
Transportation Technologies:
• Development of internal combustion engines → cars, airplanes, and machinery
• Growth of commercial shipping and aviation.
Communication technologies
• Telephone, radio, and later TV.
Transportation and Communication Costs
• Decline in transport costs
• New technologies made
ships, ports and rail
systems much more
efficient — setting the
stage for the long-run fall
in sea freight and
passenger transport
costs.
• Decline in communication
costs due to new
communication technologies.

Third Industrial Revolution:
1970s to Recent Years
Production becomes increasingly driven by information
The principal innovations:
• Computers (PC) - information can be stored and
processed at scale
• Internet - information can move instantly across
countries
• Automation - machines increasingly operate using
digital instructions
• Industrial robots and computer-controlled
machines (CNC)
Communication Costs
• The second industrial revolution
mainly transformed physical
transport, while the third industrial
revolution revolutionized
communication.
• The dramatic collapse in international
communication costs is driven by
digital and information technologies —
satellites, fiber-optic cables, computers
and the internet.
Example 1:Online Retail
Online shopping expanded rapidly
• From around 1% of retail sales in 2000 to around 15%
by 2025.
• COVID accelerated this transformation.
Online shopping does more than replace
physical stores
• It reduces transaction costs and search cost.
• Consumers can compare prices instantly and access
more products.
• Lower costs strengthen competition and can increase
economic activity.
Online shopping also changes globalization
• Consumers are no longer limited to local markets.
• Lower communication costs increase international trade
and connect economies.

Example 2: Outsourcing
Outsourcing is the practice of relocating certain production processes or services to
external firms, often in other countries, to reduce costs or increase efficiency.
• Manufacturing:
• Design in the U.S. or Europe, production in East Asia.
• Services:
• Call centers, accounting, and customer support outsourced to India or the
Philippines.
• Software & IT services:
• Global teams collaborating in real time via online platforms.
• Business processes:
• Payroll, HR, data processing handled remotely.
Results:
• IT made distance economically irrelevant, allowing to break production
into stages and locate each stage where it could be done most efficiently.
• Lower costs, greater efficiency, and deeper globalization — but also
stronger competition and unequal effects across workers.
Example 3:Financial Markets
T transformed financial markets from largely national systems into a globally integrated network.
Then (1970s):
• Financial markets were mostly national
• Investment opportunities and capital raising were largely local.
Today:
• Financial markets are globally integrated
• Capital and information move quickly across countries
Why does this matter economically?
• Capital can move to where investment opportunities are strongest
• More investment supports business growth, innovation, and development
• Financial integration became one of the key forces supporting globalization
Tradeoff:
• Greater financial integration creates more opportunities — but also increases exposure to global financial
shocks
Forth Industrial Revolution
While many economists view the Fourth Industrial
Revolution as a continuation of the Digital (Third)
Industrial Revolution rather than a completely new
technological break, there is one important distinction.
• The Third Industrial Revolution connected the world
digitally.
• The Fourth Industrial Revolution makes machines
intelligent and increasingly autonomous.
Major inventions:
• Cloud Computing
• 3D printing
• Robots
• Artificial Intelligence (AI)
Technology and Labor Markets
Technology is rapidly
transforming the workforce
in developed economies,
placing about 30% of jobs at
risk by the early 2030s.

US Employment by Sector over Time
Long-run structural transformation of
employment:
• Labor shifts from agriculture →
manufacturing → services
(“other”) as U.S economy
developed.
US Employment by Sector – Conclusions
Long run massive unemployment as Doomsday forecasts predicted never occurred.
• Agriculture:
Two hundred years ago, about 80% of the workforce was employed in agriculture. Today, that
number has fallen to roughly 2%, largely due to technological progress and productivity gains.
• Manufacturing:
Manufacturing employment initially expanded during industrialization but has been declining over
the past several decades. Many of these workers have borne the costs of globalization—
particularly job outsourcing—and technological change.
• The shift to services:
At the same time, entirely new sectors and occupations have emerged, most notably in the
service sector, absorbing much of the labor released from agriculture and manufacturing.
Long-Run US Employment – Conclusions
Past industrial revolutions reshaped labor markets, triggering major transitions in the types of
jobs people did.
• They created demand for entirely new industries—many of which are now service-
based.
• Despite short-term disruptions, these revolutions did not lead to permanent,
widespread unemployment; over time, workers moved into new roles.
Overall, economies and societies benefited from these transformations!!!
• Productivity rose, and national wealth increased.
Yet…
• Unlike the First and the Second Industrial Revolutions, the Third Industrial Revolution
has not been inclusive.
• It has primarily benefited high-skilled workers.
While many people can work in a factory or drive a car, not everyone can become
an engineer…
The Polarization of the Labor Market – Conclusions
Rising demand for high-skilled workers
• High-skilled jobs require higher education and specialized knowledge
• e.g., engineers, programmers, technical professionals
• Technology complements these workers and makes them more productive.
Rising demand for low-skilled workers
• Low skilled jobs are primarily service jobs.
• e.g., food service, personal care, cleaning, delivery
• These jobs are difficult to automate.
• Demand also increases as higher-income households consume more
services.
Declining demand for middle-skilled workers
• Industrial jobs (e.g., auto manufacturing, mining), Office and administrative
jobs
• These occupations involve routine, repetitive tasks that can increasingly be
automated or programmed.
• As a result, demand for middle-skilled workers declines.
“Downgrading”
People who worked in
middle skilled jobs cannot
find high skilled jobs.
• They don’t have the
skills.
• They are pushed to
low paying jobs -
“downgrading”
The Polarization of the Labor Market – Conclusions
• The Third Industrial Revolution did not lead to mass unemployment.
• Instead, it reshaped labor demand — growing at the top and bottom
while shrinking in the middle.
• The U.S. economy as a whole benefited from the Third Industrial
Revolution.
• The average American became richer, and the country overall became
more prosperous.
• However, these gains were not shared equally.
• A large part of the adjustment cost was borne by middle-skilled
workers
The Polarization of the Labor Market:
A Global Phenomenon
The polarization of the job market is a
global phenomenon.
Demand for medium skill workers decreased
in all EU countries
Routine jobs are disappearing
Wage Polarization and Income Inequality –
Conclusions
1960s–1970s:
• Broad economic growth – real wages increased across all education groups.
Since the 1980s:
• The pattern changes – wages become increasingly unequal.
• High-education workers continue to experience strong wage growth;
• Middle-education workers experience slower growth or stagnation;
• Low-education workers experience declining real wages (particularly among men).
Conclusions:
• The Third Industrial Revolution rewarded workers whose skills complement technology.
• Higher income inequality and increasing labor market polarization.
• Economic growth continued —but the gains were distributed much less equally across
workers
4th Industrial Revolution – The AI Revolution
AI can perform tasks that are associated with
human cognitive skills.
Traditionally, new technology made the most
educated higher skilled workers more
productive, while replacing lower skilled
workers.
AI has the potential to disrupt some highly
paid jobs, while some low skilled jobs are
actually at low risk.
AI – A Game Changer? – Part 1
High skilled jobs that are at risk:
• Legal services
• Accounting
• Financial advisors
• Engineers
AI – A Game Changer? – Part 2
At least in the foreseeable future jobs that are not at risk
Very creative jobs
• Chorographers
Jobs that require human contact or empathy:
• Psychologists
• Nurses
Manual jobs that are not repetitive or predictable:
• Janitors
• Gardeners
• Plumbers
• Electricians
AI – A Game Changer? – Part 3
Most often there will be tasks within the jobs that
will be replaced by machines:
• AI will not replace humans but humans with AI will
replace humans that don’t use AI.
• Software engineers, doctors, etc. will become
more productive.
• Entry level jobs are at risk
Technology and Labor Markets – Summary Notes
• At present, the US workforce lacks the skills
required to undertake the highly technical
and specialist work of future labor market.
• Political will and investment will be crucial
for the US government, working hand in
hand with universities and companies, to
train the next generation of employees
• US spending on public and private training
currently trails behind its industrial
competitors at less than 1 per cent of GDP.
The Importance of GDP
Why is GDP so important for economists?
• GDP measures a country’s economic size
and productive power.
• GDP summarizes many deep forces in one
number.
Technology, institutions, globalization, wars,
and industrialization all show up in long-run
GDP trends.
• GDP helps explain global power and
historical change.
• The rise and fall of countries in world history
closely follows changes in their GDP.
• If you follow GDP over time, you can already
tell a large part of the story of the world!
Definition: Gross Domestic Product
Gross Domestic Product (GDP) is the…
• Total market (dollar) value of all final goods and services
• Produced within a country
• During a given period (year, quarter)
GDP is an estimate of a country’s total economic output and total income.
GDP does not include:
• Unpaid work – stay-at-home parents
• Underground economy/illegal activity.
• Sales of used (second-hand) goods
• Pure financial transactions (e.g. buying stocks and bonds — no new production)
• Government transfer payments (e.g., unemployment benefits, pensions – no new production)
Criticisms of GDP
Some valuable activities are not included:
• Unpaid work such as childcare, elder care, and household production creates real
economic value, but is not counted in GDP.
Environmental costs are largely ignored:
• Economic activity that damages natural resources raises GDP today, even if it reduces
future living standards.
Some spending raises GDP even if it reflects social problems:
• For example, spending on security systems, private protection, prisons, or pollution
clean-up increases GDP, even though it may reflect crime, insecurity, or
environmental damage, not genuine improvements in wellbeing.
Criticisms of GDP – Part 2
GDP does not show how income is shared
• GDP can grow even when most of the gains go to a small group.
GDP does not capture many aspects of quality of life
• Health, safety, free time, job security, social connections and trust matter for wellbeing, but are
only weakly reflected in GDP.
This limitation was recognized from the start!
• Even Simon Kuznets, one of the founders of national income accounting, warned that national
income measures should not be confused with social welfare.
Criticisms of GDP – The Bottom Line
GDP is not a perfect measure of wellbeing — but it remains the international standard
measure of economic activity.
This is why organizations such as the United Nations recommend using GDP together with
additional wellbeing and sustainability indicators, rather than replacing it.
Nominal GDP vs. Real GDP
Nominal GDP – value of current
production at current market prices
Real GDP – value of current
production at base year prices
(constant prices)
GDP Deflator
(Nominal GDP / Real GDP) * 100
GDP deflator is a measure of price inflation/deflation with respect to a specific base year.
US Nominal vs. US Real GDP
• Blue line (Nominal GDP): GDP measured at
current prices (includes inflation)
• Red line (Real GDP): GDP measured at constant
prices (inflation removed).
• The gap between nominal and real GDP reflects
inflation
• Nominal GDP is steeper due to inflation.
• The two lines coincide in 2005 because 2005 is the
base year (2005 = 100).
• Both series rise over time, showing long-run
economic growth.
• The drop around 2008–2009 reflects the global
financial crisis.
Per Capita GDP
GDP / Population
• Measures the average level of income in a country.
• Helps compare living standards across countries.
• Does NOT reflect income distribution (e.g., inequality).
Countries by GDP Per Capita
• Developed economies — mainly in
North America, Western and Northern
Europe, and Oceania — tend to have
the highest GDP per capita.
• Countries with the lowest GDP per
capita are concentrated mainly in Sub-
Saharan Africa.
GDP vs. GDP (PPP)
There are two ways to measure GDP of different countries and compare
between them.
1. GDP (at exchange rate) – when the currencies of all countries are
converted into USD.
• Nominal or Real GDP are GDP at exchange rate
2. GDP (PPP) or GDP at Purchasing Power Parity (PPP)
• Accounts for the absolute purchasing power of each country’s currency.
• Purchasing Power Parity (PPP) is measured by finding the value (in USD) of a basket
of consumer goods that are present in each country.
• Reflects living standards and real consumption capacity better than GDP at
exchange rate.
GDP vs. GNP
Gross National Product (GNP) is the...
• Total market value of all final goods and services produced in a given period
• From factors of production owned by a country’s citizens.
GNP: Factors of production owned by a country’s citizens, anywhere in the world.
GDP: Production within a country (domestic)
GDP vs. GNP – When Does It Matter?
1. Countries with many citizens working abroad (GNP > GDP)
• Philippines: Millions of overseas workers send remittances home.
• Domestic production (GDP) is smaller than the income earned by citizens abroad.
• India: Large diaspora working in the Middle East and US.
2. Countries with large foreign-owned production (GDP > GNP)
• Ireland: Many multinational corporations (tech, pharma) operate there.
• Much of the profits go to foreign owners, not Irish citizens.
In these cases, GNP is often more informative than GDP, because it captures the
income that finally stays with the country’s citizens
What Is Economic Growth?
Growth – An increase in Real GDP occurring over time.
• Measures growth in total output of the economy.
Per Capita Growth - An increase in Real GDP per person occurring over
time
• Measures growth of average income/standard of living
Measuring Economic Growth
gt = (y1-yt-1 / yt - 1) x 100
- Where yt is real GDP (or Real GDP per capita) in year t.
- Example: Year Real GDP /Real GDP per Capita
2025 $15,000
2026 $15,500
g = (15,500 - 15,000/15,000) x 100 = 3.33%
Growth vs. Per Capita Growth
GDP growth shows the economy is producing more overall but doesn’t tell us if people are actually
better off.
Per capita GDP growth reflects average income and living standards, which directly affects
people's quality of life.
• Per capita growth is positive if GDP grows faster than the population.
In countries with rapid population growth, total GDP can increase even if per person income falls.
Policymakers focusing only on GDP growth may overlook declines in individual well-being.
Long-Run Trend vs. Short-Run Fluctuations
• In macroeconomics, we distinguish between
the long-run trend and short-run
fluctuations around the trend.
• Business Cycles – are short-run fluctuations
in economic activity around the trend line.
→ They mainly matter for short-run
economic conditions (recessions and
booms).
• Macroeconomics is also concerned with the
long-run effects of economic growth —
represented by The Trend Line.
Long-Run Growth
• Long-run economic per capita growth is a
relatively new phenomenon.
• Until around 1830 world per capita GDP was roughly
constant.
• In the 20th century, growth became very rapid
(close to exponential).
• The era of fastest per capita growth: 1945 (end
of WW2) and until 1973.
Growth: A New Phenomenon in Human History
• For most of human history, the
economy was essentially frozen.
• GDP per capita was essentially
stagnant.
• Why?
• Land is the main input in
production, and land is fixed
in supply.
The Catalyst: Industrialization
• 1712: Tomas Newcomen developed the first
commercial steam engine.
• 1781: James Watt radically altered the steam
engine.
• This allowed a movement from production
by hand to production by machines.
• With machines each worker can produce
more.
• Labor productivity increases
Pre Modern Era: Limited Credit
• In the pre-modern economy, access to
credit was very limited.
• Without credit, people were trapped in a
vicious cycle that kept the economy
stagnant.
A Modern Economy: A Lot of Credit
• With more credit → more investment
→ more production
→The economy grows
Credit in Early Societies – Why Was It So Limited?
• Some form of credit existed in almost all known human
societies, as far back as Sumer.
• However, only limited amounts of credit were available, and
loans were usually short-term and carried very high interest
rates.
• Why?
• There was little trust in the future.
• In a non-growing world, lending is much riskier.
• People believed that total wealth was fixed — the
economy was seen as a zero-sum game, an unchanging
pie.
Why Is There More Trust in the Modern Era?
• The Industrial Revolution introduced, for the first
time, the idea of sustained progress.
• This idea of progress quickly spread to economics.
• Trust in the future creates credit, and credit
creates growth — the economic “pie” is growing.
• Today, trust in the future is high enough that banks
can keep very small reserves, extend large amounts
of credit, and offer long-term loans at relatively low
interest rates.
A Modern Era: A Lot of Credit
• More trust → more credit → more
investment → more production → more
growth.
• In times of economic crisis, trust falls, credit is
reduced, and economic growth slows.
Growth and Standard of Living
• Economic growth over the last two centuries has dramatically improved
the human condition:
• Higher life expectancy.
• Higher literacy level and education
• Lower child mortality.
• Humans are better fed, clothed and housed.
Child Mortality
• In 1800, child mortality rates were extremely
high — more than 40% of the children did not
survive past age 5.
• Industrialization, improved nutrition, sanitation,
and healthcare dramatically reduced child deaths.
• Today, global child mortality is a fraction of
what it was 200 years ago.
• Child Mortality in developed countries is much
lower than 1%
• Brazil and China have reduced child mortality
rates tenfold over the last four decades.
• In Sub-Saharan Africa, child mortality has
been continuously falling for the last 50 years
— in the early 1960s, 1 in 4 children died
before age 5; today, it is less than 1 in 10.
Life Expectancy
• Over the last 200 years, life expectancy
has increased dramatically.
• In Europe, life expectancy has doubled and
now exceeds 80 years.
• Huge differences remain between countries.
• In Sub-Saharan Africa, life expectancy is
still below 60 years.
• In Japan, life expectancy exceeds 80
years.
Literacy
• 1800s: Literacy was limited — only a
small fraction of the population could read
and write.
• Today: Global literacy is over 85%, with
near-universal literacy in developed
countries.
Literacy – Part 2
• Regional gaps remain: Sub-Saharan
Africa and parts of South Asia still have
lower literacy rates, but progress
continues.
• Recent decades: The drop in global
illiteracy is largely driven by
emerging economies investing in
education.
Poverty
• 1820: World population just under 1.1 billion; over 1
billion people lived in extreme poverty.
• Until the 1970s: Poverty decline was too slow to
keep up with population growth.
• Absolute number of poor people increased,
even though the share of the population in
poverty declined.
• Since the 1970s: Absolute number of people in
extreme poverty is falling, despite rapid population
growth.
• Today: Less than 10% of the global population
lives in extreme poverty.
Poverty – Part 2
• 1970: 2.2 billion people living in extreme
poverty.
• 2015: 705 million people living in extreme
poverty.
• Global impact:
• Asia: Largest reduction in poverty.
• Sub-Saharan Africa: Most of the
world’s extreme poor today.
• Interesting fact: Both regions
started at similar poverty levels
in the 1970s
The Rule of 72
• Shows the number of years required for an economy to double, at a given annual rate of growth
• 72 ÷ annual % growth ≈ Years to double value
• An economy growing at 2% per year will double its GDP in about 36 years.
• (72 ÷ 2 = 36)
• An economy growing at 7% per year will double its GDP in just over 10 years.
• (72 ÷ 7 = 10.3)
• An investment earning a 4% annual return will double in value in about 18 years.
• (72 ÷ 4 = 18)
U.S. vs. China GDP & Growth
• China will finally take over the US, because
its economy is growing much faster!
• In terms of GDP (PPP), China has been the
largest economy in the world since 2014.
Economic Growth and Inequality
For years, the dominant narrative emphasized
globalization’s success in boosting global growth
and reducing poverty.
• As long as growth was strong, its distributional
consequences received little attention.
The Great Recession of 2008 changed this
perception.
• It exposed that globalization and technological
change raised global incomes — but the gains were
very unevenly distributed
The Elephant Chart
Who gained and who lost from
global income growth during
the two decades before the
Great Recession?
How to read the chart?
•X-axis: Global income
percentile
(poorest → richest individuals
worldwide).
•Y-axis: Growth in real income
(%)
•Each point shows income
growth for a specific global
income group.
The Elephant Chart – Part 2
The back (emerging economy middle class)
• Strong income growth for people in China, India,
and other emerging economies
The dip (advanced-economy middle class)
• Stagnant or very low growth for middle-income
workers in rich countries
The trunk (global top 1%)
• Extremely high-income growth for the global rich
Conclusion: Global inequality between countries
fell, while inequality within many rich countries
increased.
The Middle Class in Industrialized Economies
While economic growth continued, job security and wage
growth for the middle and lower-middle class weakened.
What happened?
• Disappearance of middle-skill jobs.
(manufacturing, clerical, routine office work)
• Rising job polarization.
(growth in high-skill and low-skill jobs)
Why?
• Technology & automation (major reason).
• Routine tasks replaced by machines and software.
• Outsourcing & global competition
• Production shifted to lower-cost emerging economies.
A Closer Look at the U.S. : The Shrinking Middle Class
Left Figure: Median income grew for all groups,
but much faster at the top.
Right Figure: The middle class's share of total
income is shrinking.
• From 1970 to 2018, the share of aggregate
income going to middle-class households fell
from 62% to 43%.
• Over the same period, the share held by upper-
income households increased from 29% to 48%!
Conclusion:
• Economic growth continued, but its benefits
increasingly accrued to the top.
• The middle class did not disappear — but it
lost economic ground.
Measure of Income Inequality: Lorenz Curve
The Lorenz curve is a graph that shows how income (or
wealth) is distributed across a population.
How to draw it?
• The horizontal axis shows the cumulative share of the
population, ordered from the poorest to the richest.
• The vertical axis shows the cumulative share of total
income.
• The 45° line is the line of absolute (perfect) equality.
• Along this line, the bottom x% of people would earn
exactly x% of total income.

Lorenz Curve - Example
Example:
• The poorest 20% of the population receive only about
5% of total income.
• First quantile – 5% of total income
• The poorest 40% receive about 14%.
• Second quantile – 9% of total income.
• The poorest 60% receive about 30%.
• Third quantile – 16% of total income
• The poorest 80% receive about 53%.
• Fourth quantile – 23%
• Fifth quantile – 47%
This Lorenz curve Indicates substantial income inequality
• Top quantile earns about 9 times more than bottom
quantile.
How to Compare Two Lorenz Curves?
The farther the Lorenz curve is from the 45° line, the greater the inequality.
• At perfect equality, Lorenz curve coincides with the line of equality.
• At maximum inequality, Lorenz curve lies along the axes and jumps to 100% at the last
person.
Measure of Income Inequality: Gini Coefficient
The Gini coefficient (also Gini index or Gini ratio) is the most
used measure of income distribution.
It’s directly related to the Lorenz curve.
• Measures the area between the Lorenz curve and the line
of perfect equality, relative to the total area under the line of
perfect equality:
• It is a ratio between 0 and 1.
Gini coefficient = A / (A + B)
Combining Lorenz Curve and Gini Coefficient
G = 0 → perfect equality (everyone has the same income)
• Lorenz curve coincides with the line of equality.
G = 1 → maximum inequality (one person has all the income)
• Lorenz curve lies along the axes and jumps to 100% at the last person
Lorenz curve closer to the diagonal → smaller area → lower Gini → more equal
Lorenz curve more bowed → larger area → higher Gini → more unequal

Gini Coefficient – International Comparison
• Income inequality is generally higher in Sub-Saharan Africa and Latin
America than in other regions of the world.
• South Africa ranks as the country with the highest level of income
inequality in the world - Gini coefficient of 63/100 (2014 data).
• In South Africa, the richest 10% hold 71% of the wealth
• The poorest 60% hold just 7% of the wealth.
• More than half of South Africa’s population lives in poverty.
• The United States has the highest level of income inequality in the
developed world
• Income inequality is generally lower in Europe than in other regions of
the world.
• Nordic and Central & Eastern European countries are the most equal
(7 out of 10 most equal countries)
The Redistributive Role of Taxes and Transfers
In modern economies taxes and transfers are the main tools
used to decrease income inequality.
• Taxes - compulsory payments collected by the government
from households and firms to finance public spending.
• Money the government collects from people and
firms.
Transfers - payments made by the government to individuals or
households without receiving goods or services in return, usually to
support income.
• Money the government gives to people and firms.
• Examples: unemployment benefits, Social Security
(retirement and disability benefits), food stamps.
The Redistributive Role of Taxes and Transfers – Part 2
Taxes and transfers move income from higher-income
groups to lower-income groups, reducing the gap between
rich and poor.
• Taxes reduce households’ disposable income,
especially for higher-income households.
• Transfers and social benefits increase the
disposable income of lower-income households.
Together, taxes and transfers change the distribution of
income and therefore reduce overall income inequality.
Figure: Income inequality is lower after taxes and transfers