ENVR 301 - Quiz 1
 Call Kai
 Learn
Learn Practice Test
 Spaced Repetition
 Match
Match Flashcards
 Knowt Play
1/72

There's no tags or description
Looks like no tags are added yet.
Name | Mastery | Learn | Test | Matching | Spaced | Call with Kai | Chat |
|---|
No analytics yet
Send a link to your students to track their progress
73 Terms
what is a literature review?
“what do the authors (of current lit) tell (/ not tell) us?”
background research - cocktail party funnel
establishes what’s already studied & identifies major themes/debates
compares & contrasts studies
evaluates strengths, limits, & examines gaps
ultimately, frames research question
what are the different kinds of research question?
descriptive
comparative
causal
explanatory
experiential
what is validity?
answering question that was asked
making sure you are measuring what you think you are measuring
improves credibility, trust, rigour, reproductibility, & replicability
what are the 3 common types of validity?
internal
external
construct
what is internal validity?
did treatment X cause observed effect Y?
maybe not:
complicating variables, history
selection bias
measurement error
ex. research concludes that a new wetland restoration technique improves biodiversity, but restored wetlands received other funding & invasive species were also eradicated
was it the restoration technique or extra funding?
created causal path, but other factors involved
what is external validity?
can the results be generalised?
generalised across… places, species, populations, time, etc
ex. study shows urban tree planting lowers summer temp in Vancouver
can same effect be assumed in:
Phoenix? Yellowknife? - diff climates & biomes
tropical cities?
1800s Vancouver?
greater Vancouver area?
what is construct validity?
are we measuring the concept/construct that we think we are?
challenge in envr/soc.sci.: many indirect measurements - ‘constructs'
can’t measure directly, & thus must be indirect
ex. sustainability, ecosystem health, biodiversity, resilience, envral justice
researchers must infer from indicators, multiple variables, or methods
what is often a req. for good construct validity?
multiple variables/indicators
often not just available data
sometimes need both primary & secondary data
*often measurement method shapes research
*should define all words in a research question - should imply methods
what is uncertainty?
a part of research - envrally, cannot be certain (complex & hard to holistically research)
acknowledging it: identifying what is unknown, variable, ambiguous or incorrect
not same as confidence
what is confidence?
assessment of how strongly evidence supports claim
what are the stages of group development?
forming (get to know each other, set expectations)
storming
norming (deal openly w/ misunderstandings)
performing
what are the steps to research a topic?
define a topic
select a search tool
evaluate search results
what are the steps to define a research topic?
prepare question (narrowed down)
identify key concepts & synonyms
build query w/ key words
make a concept table
keeps key terms in living document
do background reading/preliminary searching
can use booleans, wildcards, truncation
what is grey literature / data?
gov, university, or business produced data
often published in alternative places & not systematically indexed
not publishing focused (in an academic way)
what is the criteria for evaluating search results?
Currency: publication date
Relevance: treatment of topic
Authority: credentials (author & publisher)
Accuracy: verifiable claims, bibliography
Purpose: objectivity / bias
what are common sources of uncertainty?
measurement: accurate / precise instruments & observations?
data: missing, biased, unevenly distributed? data poverty (missing areas)?
models: how well does model rep. reality?
!create exact models of world, can only represent them
every model has biases, want best representation
spatial scale: same pattern seen at diff scale?
some things !exist at certain resolutions
temporal change: will relationship(s) stay stable over time?
human behaviour: how might people respond diff than expected?
unknowns: factors !considered?
what is the expected findings section?
anticipate patterns/trends & associations/causation
not predictions suggesting answer already known
remain open to conflicting results!
see contributions based on theory (ie. lit review) or evidence to investigate
often final section of proposal
why do we need randomisation to measure an experiment?
can’t only measure pre-existing correlations - risks confounds!
ex. paper notes, performance, & skill/interest
skill/interest could cause choice to use paper
measuring impact of paper use on performance
but skill/interest could actually cause performance w/o any relationship btwn paper & performance
both paper & performance stem from skill/interest
randomisation deletes causal pathway btwn skill/interest and choice to use paper (no longer oonceptually flawed)
what is a confound?
when a correlation is confused for a causal relationship
what is correlation versus causation?
correlation: two variables appear to be in sync / have connected patterns
property of a data set
arithmetic & always computable
causation: one variable causes direct correlated changes in the other variable
property of the world
claim about what would happen if smth changed
what do we use models for?
analysing observations & measurements, whether for predictions or explanations
what is a prediction versus an explanation?
prediction: can find descriptively
generally, statistically sig. correlational findings sufficient for prediction
explanation: requires casuality
correlation !sufficient, but can use to go backwards & guess a cause
the data generating process (DGP)
requires some understanding of the real world & the measurement process
still has some causality (ie. way of choosing the sample)
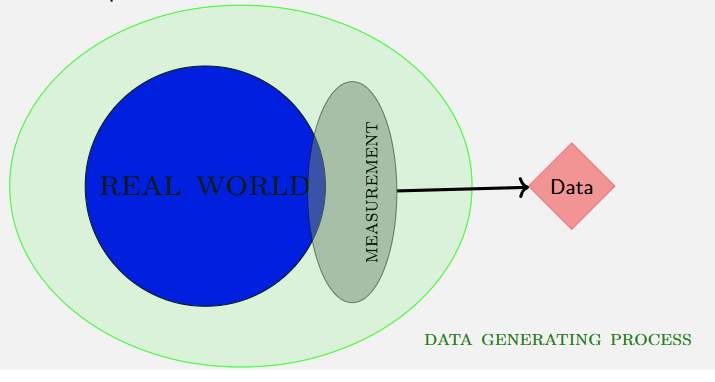
what is the ladder of causation?
association (observing): correlation in general sense (understanding regularities, ie. associating rooster’s call & sunrise)
intervention (doing): deliberate alterations of envr to produce a desired outcome (ie. use knowledge to feed into policy)
counterfactuals (imagining): statements about worlds where we have not yet intervened & may never intervene
levels of understanding
what are the three different research goals?
to measure a static value - descriptive
to predict something (ie. probability of ice storm this year in MTL) - prescriptive
to identify/measure a causal pathway - causal
what is the role of a model?
to make an inference from data in each of the Ladder of Causation cases
*inferences = probabilistic statements
describe how measurement, real-world relationships, & real world causality may have generated data
use & test & refine them to infer:
characteristics of the pop. from the sample
real-world relationships
causation (useful insight for intervention)
what is the data gathering process (inferential statistics)?
produce data
exploratory data analysis
probability
inference
generalising from random sample to population
key terms: sampling frame
researcher’s list/device specifying pop. of interest (from which sample is drawn)
ideally, sampling frame matches the sample!
what must be controlled for when mapping & inferring causality?
confounds - can do this by controlling variables
correlation def
sets of data
can’t be 2 #s, need multiples (ie. across lakes, tdays, etc)
not a property of observation
what are different kinds of correlation?
spatial (ie. diff lakes sporatically)
qualitative (characteristics/shapes, ie. colours & shapes)
temporal (ie. same lake over a year, but need to be aware of particularities, like seasonality)
*autocorrelation = misleading (variables correlated with themselves)
what is a time series?
random walks, rather than independent random steps (which has much lower correlation generally)
random steps in random directions, measure walking level
some level of persistence
2 series w/o anything in common can easily look related by chance, because they’re random
when to be cautious of autocorrelation due to persistence?
in time series or spatial measurements
what is & isn’t r?
what are correlational controls? & what are they used for?
statistical adjustments
can be used to control for more precision (see what changes via this particular causal path)
what is a sampling bias?
induced by the sampling itself
ie. if using gov data that increases (has more sampling) when there are more reports of dead fish/stinky water
can re-weigh data to take sampling bias into account
what are common causal diagram problems?
too many uncontrollable factors
unmeasureable things (ie. personality traits)
hard to measure (ie. diet)
skewed/limited external validity
what is a DAG?
Directed Acyclic Graph
acyclic = no causal loops
what are the four foundamental confounds?
fork — include control
pipe — bad control (controlling for z can mess up correlation btwn x & y)
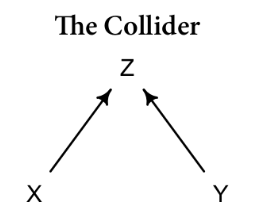
collider — bad control (controlling for z can cause correlation btwn x & y that does not exist)
descendent — bad control (controlling for D would be like controlling for z in a collider map)
what is a fork DAG?
z = common cause
control for z

what is a pipe DAG?
z = mediator
do NOT control/include

what is a collider DAG?
z = common outcome
do NOT control/include
what is a descendent DAG?
collider + descendent of z, D
do NOT control for D - would be like controlling z

what are the necessary conditions for drawing a causal relationship?
time order (cause before effect)
co-variation (statistical correlation - change in independent variable accompanied by change in dependent one)
rationale (logical & compelling explanation for why 2 variables = related - the “mechanism”)
non-spuriousness (must be established that independent variable X & only X = casue of claimed variation in dependent variable Y - alternate explanations must be ruled out)
what are sources of variation?
spatial
temporal
demographic value
what is a fundamental versus root cause?
all conditions = causes
hard to find 1 root cause, depends on definitions
fundamental: often rhetorical (policy interest)
what do qualitative methods measure?
how people make sense of the world (experiences, perceptions, relationships, meanings, practices, etc)
what are critiques of / problems w/ qualitative analysis?
trust & confidence
lack of statistical rigour
lack of validity
inability for reproducibility & replicability
what is reproducibility versus replicability?
reprod.: rerunning same research = same result
replic.: rerunning similar research = similar result
sampling is…
often needed & method-dependent
random sampling easily subjected to bias (hard to get truly random sample)
what are common approaches to sampling?
purposive sampling: select participants w/ relevant knowledge
snowball sampling: participants recommended by others
often used for expert knowledge
maximum variation: seek diverse perspectives
opposite of snowball
theoretical sampling: collect data based on grounded theory
directs to others who should be included in the sample
synthetic sampling (use AI to simulate responses)
what are common problems in sampling?
“convenience” sampling: those easiest to reach
unclear population: who/what is sample representing?
small =/= representative: could only interview 3 ppl
selection bias: respondents differ from those excluded
mismatch w/ research question or unit of analysis
no reason for sample: must justify why this sample size & selection strategy?
generalisation: can conclusions be drawn abt larger pop. from sample? is it representative?
spatial variation: only accessible sites can miss diff. in pollution, species, socioeconomics, etc
*inevitable, must simply account for it
what is a unit of analysis?
what = researched
what data = collected for
what findings = expected to be
what are some commonly used methods?
observation
case studies
content analysis
ethnography
surveys/interviews
instrument coding
focus groups
participatory research
what is the observation method?
instead of asking ppl, observe what they do
requires observation protocol! (what to observe & for how long)
role of observer vs observed
ie. how do ppl use an urban park during extreme heat? observe: where ppl sit, where/if they seek shade, how long they stay, interactions btwn grp, demographics, use of water infrastructure
aim to put in water features & simply observe ppl’s reactions
what is the case study method?
method to contextualise a phenomenon: need justification
!just convince, often ?? method contrary other method
protocol needed to make it systemic & replicable!
case could be: community/city, or hbh/ecosystem/policy/org./envr.
can be confused w/ U. of A.
ie. case study of MTL vs TRT risk study
what is the content analysis method?
analyze media (gov. policies, newspaper articles, speeches, social media, meeting minutes, photos, archives, maps, etc)
draw on lit review & analyse what patterns/codes mean
ppl !only data source
**triangulate (key for construct validity)!! make sure to decode & interpret!
what is the ethnography method?
immersion in envr to understand practices & underlying meanings
take time to understand essence of issues
may observe, participate, interview, take field notes, collect docs & artifacts
like case study
ie. spend 3 months in community responding to floods
instead of asking what ppl think via survey/interview, learn how it becomes part of everyday life first-hand
what is the survey/interview method?
looking for frequency of smth: surveys
more in-depth: interviews
also more flexible - can have follow-ups (but not too much, or else hard to synthesize various responses)
can triangulate - ie. interview first, then use broader population surveys to corroborate
includes some quanitfication
amount varies, sample size vs. n
greater response rate more important than large sample !
must be conscious of length!!
what are the three survey/interview types?
structured
semi-structured
unstructured
what is a structured survey/interview?
set questions & order
limited flexibility
easier to understand (not as much interpreting, limited open-ended questions)
what is a semi-structured survey/interiew?
guided - open-ended w/ follow-ups
harder to analyse/generalise - harder to compare answers (personal nuance allows for wide range of responses)
what is an unstructured interview?
more conversational & exploratory, few pre-determined questions
very hard to analyse
what are survey/interview question types?
selection/short-form (MC, rating or Likert scale, matrix, etc)
open-ended
demographic
image choice
interview/survey instrument advice
question order matters !
avoid leading, double-barrel, or embarrassing questions
ask (moderately) open-ended questions
be mindful of time needed to complete
test & pre-test instrument + design coding instrument (ie. spreadsheet) alongside it
what is instrument coding?
often must be inferred from response
where triangulation is more important !
codes can be grped into broader categories/themes
ex. “the city keeps talking about resilience, but we’re the ones cleaning up after every flood!”
possible codes: resilience, municipal codes, community (residential labour), flooding
what is the focus group method?
goal = interaction itself
also requires protocol! not a sample
bring in ppl by profiles, !random
examine: agreement/disagreement, consensus (ie. on priorities) - not always desirable, debates, conflict, social norms/cultural values
ie. “how should rural region respond to increased wildfire risk?”
who do u invite (diff demographics)? what do u record (diff interactions/(dis)agreements)?
what is the difference between traditional & participatory research?
traditional: researcher studies community
participatory: researcher collabs w/ community
*note demographic & traditional differences when entering diff societies/norms/cultures
discrepencies btwn grps, may not be able to access everyone w/in a grp
what might participants do in your research?
identify actual research questions (may not be your research question)
collect data
interpret findings
generate maps & other outputs
evaluate ur results
determine how findings are used
what is the participatory research method directed by?
who has the power to define a research problem
shift & sharing of power
what are critiques of participatory methods?
more uncertainty
personal involvement (what if community found to be bad actors?, researcher’s normative choices poke holes in neutrality - ie. not working w/ neo-Nazis)
what are scientists needed for if mass recruitment of citizen scientists?
what ‘r’ does tell you
a unit-less number, comparable across studies
how tightly a points cloud hugs a straight line
direction of line tilt
what ‘r’ doesn’t tell you
line steepness, or if the effect matters
if relationship = straight line at all
if one point = doing all work
if the units of observation = independent
always plot data carefully & say what units of obs. are !
which variable influences which - it is symmetric