Honors Thesis Exam 1
 Call Kai
 Learn
 Practice Test
 Spaced Repetition
 Match
 Flashcards
 Knowt Play
1/76

There's no tags or description
Looks like no tags are added yet.
77 Terms
Statistical Bias
Distorted results caused by breaking statistical rules like normality or equal variance. Example: using a regular t-test on heavily skewed data.
Assumption of Normality
The requirement that scores form a symmetrical bell curve. Example: checking whether exam scores follow a bell shape before running a t-test.
Kolmogorov-Smirnov Test
A test checking if data fits a normal curve. A result with p>.05 means normal, while p<.05 means non-normal.
Assumption of Homogeneity of Variance
The requirement that groups have roughly equal score spreads. Breaking this raises false positive risk.
Levene's Test
A test checking if group variances are equal. A result of p≤.05 means variances are unequal, breaking the rule. Example: testing if anxiety score spreads match across three therapy groups.
Assumption of Linearity
The rule that two variables form a straight line when graphed, which is required for correlation and regression.
Deviation from Linearity Test
An SPSS test checking if a relationship curves instead of staying straight. A result of p<.05 means the straight-line rule is broken.
Null Hypothesis (H0)
The starting assumption that there is no real effect, difference, or relationship, meaning results are just luck.
Alternative Hypothesis (H1)
The research prediction that a real effect or difference exists.
Statistical Significance
A result unlikely to be caused by random chance, usually when the probability is under 5% (p<.05).
Alpha (α) Level
The cutoff used to reject the null hypothesis, standardly set at p<.05. It sets the allowed risk of a false positive.
One-Tailed Test
A test checking for a difference in only one direction. It gives more power to find that effect, but completely misses effects in the opposite direction. Example: testing only if a pill improves memory, ignoring if it harms it.
Two-Tailed Test
A standard, conservative test checking for an effect in both directions (increase or decrease). Example: testing if a drug either raises or lowers blood pressure.
Type I Error
A false positive where you claim an effect is real, but it is actually not. Example: concluding an ineffective pill works.

Type II Error
A false negative where you miss a real effect. Example: deciding a good medicine does not work because your study had too few participants.
Statistical Power
The chance of correctly catching a real effect (1−β). Power rises with larger sample sizes.
Effect Size
A score showing the practical size of an effect, unaffected by sample size. Example: Cohen's d=0.80 shows a large real-world improvement, rather than just a statistically significant change.
Normal Distribution
A symmetrical bell curve where the mean, median, and mode match. About 68% of scores sit within 1 standard deviation, and 95% sit within 2. Example: standardized IQ scores centered at 100.
Skewness
A measure of how lopsided data is. Values between −1 and 1 are generally normal.
Positive Skew
A curve with a long right tail pulled by high scores, where Mode<Median<Mean.
Negative Skew
A curve with a long left tail pulled by low scores, where Mean<Median<Mode.

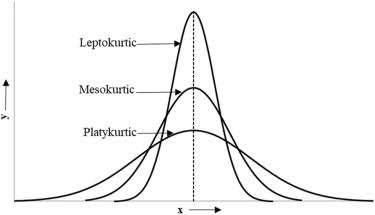
Kurtosis
A measure of how peaked the center is and how thick the tails are compared to a normal curve. Values near 0 are normal.
Leptokurtic
A tall, sharp peak with thick tails and many extreme outliers.

Platykurtic
A short, flat curve with thin tails and few outliers.

Mesokurtic
A standard bell curve with average peakedness and kurtosis near 0. Example: adult heights across a large group.
Outlier (IQR Rule)
A score more than 1.5×IQR outside the first or third quartile, shown as dots in SPSS boxplots.
Histogram
A graph with touching bars showing score frequencies in continuous bins, useful for checking shape and spread.
Bar Graph
A graph with separated bars showing counts or averages across separate categories. Example: comparing average salaries across psychology, business, and art majors.
Population Pyramid
Two back-to-back histograms sharing an axis to compare continuous scores across two groups. Example: comparing age spreads between men and women.
Boxplot
A plot showing the median line, middle 50% box, whiskers, and outlier dots to display spread. Example: comparing recovery days across three hospital treatments.
Scatterplot
A graph of coordinate dots used to spot the direction and shape of a relationship between two continuous variables. Example: plotting study hours against exam grades.
95% Confidence Interval Error Bars
Bars showing where the true population average is 95% likely to fall. Non-overlapping bars suggest a real difference. Example: comparing drug versus placebo score ranges on a graph.
Nominal Data
Unordered categories with labels only. Example: eye color, biological sex, or college major.
Ordinal Data
Categories with a clear rank order, but unequal spacing between ranks. Example: race finish positions (1st, 2nd, 3rd) or satisfaction ratings.
Interval Data
Numbers with equal steps between values, but no true zero point. Example: temperature in Celsius or Fahrenheit, where 0 does not mean heat is absent.
Ratio Data
Numbers with equal steps and a true zero point where zero means none. Example: money, weight, reaction time, or height.
Sampling Error
The natural gap between sample results and the true population, which shrinks as samples get bigger. Example: getting an average height of 5ft9in from 30 people when the true population average is 5ft10in.
Operational Definition
A specific description of how a variable is measured or manipulated.
Quasi-Experimental Design
A study comparing preexisting groups without random assignment. Example: comparing lung health between smokers and non-smokers.
Counterbalancing
Rotating task order across participants to cancel out fatigue and practice effects. Example: having half the participants do Task A first and the other half do Task B first.
One-Way ANOVA
A test comparing averages across three or more groups in one step to prevent false positives. Example: testing if exam grades differ across three teaching methods.
F-Statistic
The ratio of between-group differences to within-group noise (F=WithinBetween). High values show real group differences.
Post-Hoc Tests
Follow-up tests run after a significant ANOVA to find which specific group pairs differ. Example: testing if Group 1 beat Group 2 after an ANOVA shows an overall difference.
Fisher's LSD
An unadjusted post-hoc test with a high risk of false positives (Type I error).
Bonferroni Post-Hoc Test
A strict post-hoc test that lowers alpha to stop false positives, but risks missing real effects (Type II error).
Tukey's HSD Post-Hoc Test
A balanced post-hoc test that manages both false positives and missed effects, clustering similar means together. Example: finding which specific caffeine levels differ in alertness.
Partial Eta Squared (ηp2)
An ANOVA effect size showing the share of variance explained: 0.01 is small, 0.06 is medium, and 0.14 is large. Example: an ηp2=0.08 meaning a treatment explains 8% of score changes.
Independent-Samples t-Test
A test comparing averages between two separate, unrelated groups. Example: comparing exam scores between online and in-person classes.
Dependent-Samples t-Test
A test comparing the same group twice, which boosts power by removing individual differences. Example: testing blood pressure in patients before and after a diet.
Cohen's d
A t-test effect size showing how many standard deviations apart two means are: 0.20 is small, 0.50 is medium, and 0.80 is large.
Mann-Whitney U Test
A non-parametric test comparing two separate groups when data breaks the normality rule or uses ranks. Example: comparing customer star ratings between two store locations.
Wilcoxon Signed-Rank Test
A non-parametric test comparing the same group twice when difference scores are not normal. Example: comparing pain scores from 1 to 10 before and after physical therapy.
Reliability vs. Validity
Reliability means consistency, while validity means accuracy. A test can be consistent without being correct. Example: a broken scale giving the exact same wrong weight every day is reliable but invalid.
Test-Retest Reliability
How consistent test scores stay when the same test is taken twice over time. Example: getting almost the same score on a personality test two weeks apart.
Internal Consistency
How well different items on the same test measure the same concept. Example: checking that all questions on a depression survey point to depression.
Cronbach's Alpha (α)
A scale consistency score from 0 to 1, where 0.70 or above is acceptable.
Cohen's Kappa (κ)
A score measuring agreement between two raters while removing chance agreement, where over 0.60 is good.
Face Validity
Whether a test looks relevant and appropriate on the surface. Example: a math exam consisting of numbers and equations.
Content Validity
Whether a test covers the full range of material it is supposed to cover. Example: a final exam that tests all chapters covered in class.
Predictive Validity
How well a test predicts future performance. Example: using SAT scores to predict college grades.
Concurrent Validity
How well a new test matches an established test taken at the same time. Example: a short 5-minute anxiety quiz matching a 1-hour psychiatric assessment.
Construct Validity
Whether a test accurately measures the underlying theoretical concept it claims to measure. Example: confirming an anxiety test measures fear and not anger.
Convergent Validity
When a test relates strongly to other tests measuring the same concept. Example: a new happiness test scoring high when an established happiness test scores high.
Divergent Validity
When a test shows little to no link with tests measuring unrelated concepts. Example: a depression test having near-zero correlation with a math ability test.
Reverse Coding
Flipping backward-phrased survey answers in SPSS so higher numbers always mean the same thing.
Factorial ANOVA
An inferential statistical test used to evaluate the simultaneous effects of two or more categorical independent variables on a single continuous dependent variable.
Mixed Factorial ANOVA
An ANOVA design that incorporates at least one between-subjects independent variable and at least one within-subjects (repeated measures) independent variable.
Between-Subjects Factor
An independent variable where each participant is assigned to only one level or condition of the factor.
Within-Subjects Factor
An independent variable where every participant is exposed to and measured across all levels or conditions of the factor.
Main Effect
The overall effect of a single independent variable on the dependent variable, collapsed or averaged across all levels of the other independent variables.
Interaction Effect
A statistical outcome in factorial ANOVA where the effect of one independent variable on the dependent variable depends on or differs across the levels of another independent variable. No interaction when lines are parallel.

Ordinal Interaction
A pattern of interaction where an effect is present in one group, but is weaker or absent (no effect) in the comparison group, without reversing direction.
Disordinal Interaction
A pattern of interaction where an effect is present in one group, and the complete opposite effect is present in the comparison group, typically displayed as an X

Simple Effects Test
A follow-up analysis used to make sense of a significant interaction by breaking it into smaller parts and testing the effect of one independent variable separately at each level of the other independent variable.
Partial Eta Squared (ηp2)
An effect size estimate reported in ANOVA output that quantifies the proportion of variance explained by a specific main effect or interaction after accounting for other factors.
One-Way Within-Subjects ANOVA
A repeated-measures design that evaluates differences across two or more conditions within the same subjects, configured in SPSS Repeated Measures by leaving the Between-Subjects Factor(s) box empty.
Profile Plots
Line or bar graphs specified in SPSS ANOVA dialogs by assigning independent variables to the horizontal axis and separate lines to visually inspect cell means and interactions.