A level Bio 3.4 Mass transport in Animals Part II
 Call Kai
 Learn
 Practice Test
 Spaced Repetition
 Match
 Flashcards
 Knowt Play
1/16

Earn XP
Description and Tags
17 Terms
Explain why both the heart and arteries are described as organs. (1)
contains more than one tissue/type of cell (1)

Which of blood vessels A to E contains blood at the lowest pressure? (1)
E (1)
hepatic vein has traveled through two full networks of capillaries,
Elastic tissue in the walls of blood vessel A helps to even out the pressure of blood through this vessel. Explain how. (2)
(Elastic tissue) stretches when pressure in high (1)
Springs back/recoils /returns to normal when pressure is low (1)
Erythropoietin (EPO) is a substance produced in the body. It increases the production of red blood cells. Synthetic EPO is made artificially. It is used to treat patients who have a form of anaemia in which there is a reduced number of red blood cells. Scientists investigated the effect of synthetic EPO on volunteers with this form of anaemia.
• The scientists injected synthetic EPO in a salt solution into patients in the experimental groups. They also set up control groups.
• They gave the different experimental groups different doses of synthetic EPO and different lengths of treatment.
• At the beginning and end of the treatment, the scientists measured each patient’s haemoglobin concentration. From these measurements, they calculated the mean increase in haemoglobin concentration.
Some of the results are shown in the table.
| Number of volunteers | Length of treatment / weeks | Dose of synthetic EPO / units per kilogram | Mean increase in haemoglobin concentration / arbitrary units |
| 58 | 8 | 85 | 19.0 |
| 18 | 8 | 170 | 26.0 |
| 40 | 12 | 150 | 12.5 |
| 82 | 12 | 450 | 34.2 |
| 46 | 24 | 120 | 23.0 |
| 53 | 24 | 240 | 31.0 |
The scientists measured the dose of synthetic EPO per kilogram per week.
Explain why they measured the dose per unit mass and per unit time. (2)
Allows comparison to be made (1)
Different masses/weights (of volunteers) (1)
Erythropoietin (EPO) is a substance produced in the body. It increases the production of red blood cells. Synthetic EPO is made artificially. It is used to treat patients who have a form of anaemia in which there is a reduced number of red blood cells. Scientists investigated the effect of synthetic EPO on volunteers with this form of anaemia.
Some of the results are shown in the table.
| Number of volunteers | Length of treatment / weeks | Dose of synthetic EPO / units per kilogram | Mean increase in haemoglobin concentration / arbitrary units |
| 58 | 8 | 85 | 19.0 |
| 18 | 8 | 170 | 26.0 |
| 40 | 12 | 150 | 12.5 |
| 82 | 12 | 450 | 34.2 |
| 46 | 24 | 120 | 23.0 |
| 53 | 24 | 240 | 31.0 |
Explain how the information that the scientists collected might be useful in treating patients with anaemia (2)
To determine (most effective) dose/length of treatment (1)
Investigate long term effect/toxicity/side effects
Erythropoietin (EPO) is a substance produced in the body. It increases the production of red blood cells. Synthetic EPO is made artificially. It is used to treat patients who have a form of anaemia in which there is a reduced number of red blood cells.
Some athletes have used synthetic EPO as a performance enhancer. Explain how synthetic EPO may improve performance in long-distance events. (4)
More haemoglobin/more red blood cells (1)
(More) oxygen can be absorbed/transproted to respiring tissues/cells (1)
More energy released/more ATP for muscle contraction (1)
Delays anaerobic respiration (1)
Erythropoietin (EPO) is a substance produced in the body. It increases the production of red blood cells. Synthetic EPO is made artificially. It is used to treat patients who have a form of anaemia in which there is a reduced number of red blood cells.
Some athletes have used synthetic EPO as a performance enhancer.
Athletes may be tested to see if the concentration of EPO in their blood is above normal. Suggest how scientists determine the normal concentration of EPO in blood. (2)
Large sample / wide range (of individuals tested) (1)
Random sampling
Erythropoietin (EPO) is a substance produced in the body. It increases the production of red blood cells. Synthetic EPO is made artificially. It is used to treat patients who have a form of anaemia in which there is a reduced number of red blood cells.
Synthetic EPO can increase blood pressure. Suggest why. (1)
Blood is thicker(1)

Scientists investigated the heart activity of humans at rest, during medium-intensity exercise and during high-intensity exercise. Figure 2 shows the scientists’ results.
Stroke volume = volume of blood leaving a ventricle with each contraction
Cardiac output = stroke volume × heart rate
Use all the information to describe what causes the increase in cardiac output:
• from rest to medium-intensity exercise
• from medium-intensity exercise to high-intensity exercise.
You do not need to calculate cardiac output to answer this question. (2)
(Rest to medium-intensity exercise) Increased stroke volume and increased heart rate (1)
(medium-intensity exercise to high-intensity exercise) Increased heart rate (1)
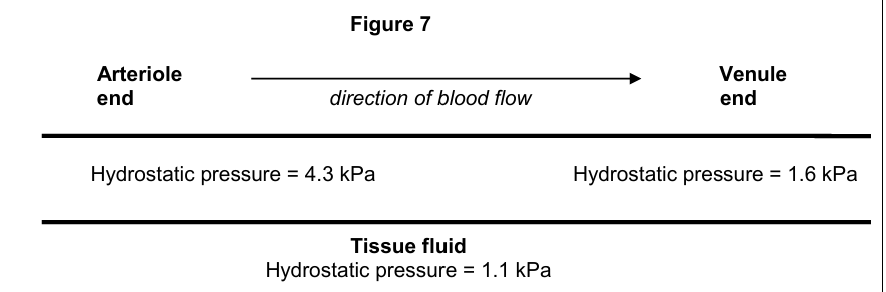
Figure 7 represents a capillary surrounded by tissue fluid.
The values of the hydrostatic pressure are shown.
Use the information in Figure 7 to explain how tissue fluid is formed (2)
(Overall) outward pressure of 3.2kPa (1)
Forces small molecules out of capillary (1)
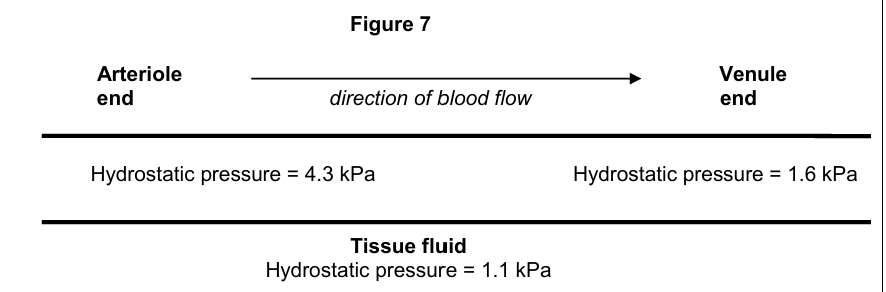
Figure 7 represents a capillary surrounded by tissue fluid.
The values of the hydrostatic pressure are shown.
The hydrostatic pressure falls from the arteriole end of the capillary to the venule end of the capillary. Explain why (1)
Loss of water (against capillary lining) (1)
High blood pressure leads to an accumulation of tissue fluid. Explain how (3)
High blood pressure = high hydrostatic pressure (1)
Increases outward pressure from (arterial) end of capillary (1)
So more tissue fluid is formed (1)
The water potential of the blood plasma is more negative at the venule end of the capillary than at the arteriole end of the capillary. Explain why (3)
Water has left the capillary (1)
Proteins in blood too large to leave capillary (1)
Increasing concentration of blood proteins (1)

The chart shows the change in the speed of flow and pressure of blood from the start of the aorta into the capillaries.
Describe and explain the changes in the speed of flow of the blood shown in the chart. (2)
Slow decrease in speed until reaches arterioles than rapid decrease (1)
more friction (1)
In one cardiac cycle, the volume of blood flowing out of the heart along the pulmonary artery is the same as the volume of blood returning along the pulmonary vein. Explain why the volumes are the same although the speed of flow in the artery is greater than in the vein. (1)
Wider lumen so greater volume carried (1)
The table shows the mean diameter of the lumen and the rate of blood flow in some types of human blood vessel.
Type of blood vessel | Mean diameter of lumen / | Rate of blood flow / |
Artery | 400 | 10 – 40 |
Arteriole | 30 | 0.1 – 10 |
Capillary | 8 | less than 0.1 |
Using information in the table, explain what causes the rate of blood flow to be slower in capillaries than in other vessels. (2)
small lumen/increase in (total) cross sectional area (1)
more surface in contact with blood/greater friction (1)

Tissue fluid is formed when water and small molecules pass out of capillaries at their arterial end. The diagram shows some pressures involved in tissue fluid formation. The relative lengths of the arrows indicate the size of the pressures.
Explain why there is a net loss of water from a capillary at the arterial end (2)
hydrostatic pressure is greater than pressure of water potential gradient (2)