ME115 - Week 9
 Call Kai
 Learn
 Practice Test
 Spaced Repetition
 Match
 Flashcards
 Knowt Play
1/26

Earn XP
Description and Tags
Creep Evaluation, Fatigue 1
27 Terms
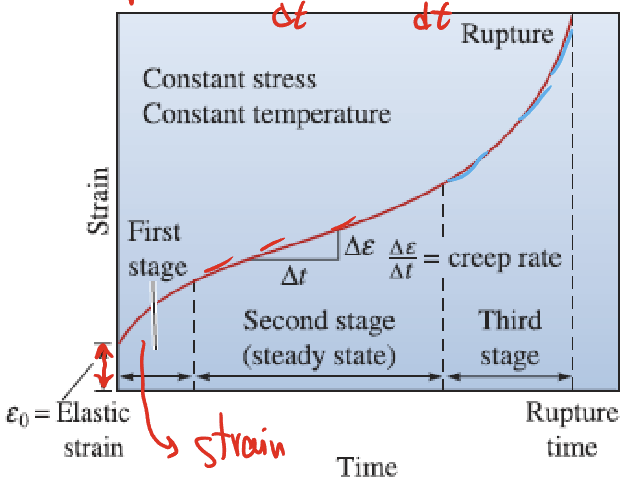
Creep Rate
How fast a material deforms: Δε/Δt or dε/dt
What information do we get from a creep test?
Creep rate, total creep strain (deformation), time needed to reach a desired strain, time to rupture.
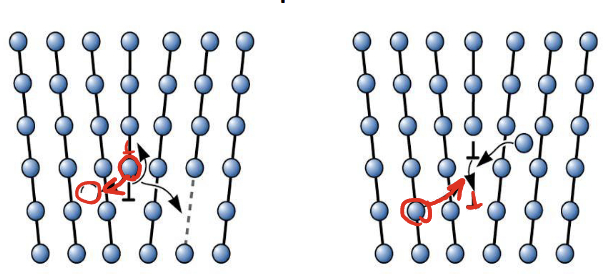
Dislocation Climb
Caused by diffusion and high temperatures, when a dislocation is able to move perpendicularly out of its slip plane, this allows them to go around obstacles that they wouldn’t usually be able to which allows for more plastic deformation than usual.
First Stage of Creep
Also known as the primary stage. The slope of the creep rate is decreasing (logarithmic), this is caused by strain hardening
Second Stage of Creep
Also known as steady state creep behavior because the creep rate is linear. This is because the strain hardening is starting to reach a saturation point but the diffusion and dislocation climb makes it easier for dislocations to move. This all results in a constant rate of deformation.

Third Stage of Creep (tertiary stage)
Creep rate is exponential (increasing), micro-voids are joining together and create lower load bearing areas which puts the material under more stress and causes increasing deformation.
Grain Boundary Sliding
Grains can slowly slide relative to each other along grain boundaries, especially at high temperature.
Recovery Mechanisms
These are behaviors of a material under creep that reduce the buildup of internal defects, especially dislocations; allowing the material to continue deforming without the dislocation density increasing as rapidly. This allows for the steady rate of deformation in the second stage of creep.
Some examples of these are diffusion and grain boundary sliding.
What is the effect of temp and stress on creep tests?

Secondary Creep Rate (Steady State Creep)
Arrhenius equation (temperature dependent), constant.
C and n are material dependent constants (usually n~5)
Qc is the activation energy for creep → lower the activation energy, higher the creep rate (negative)

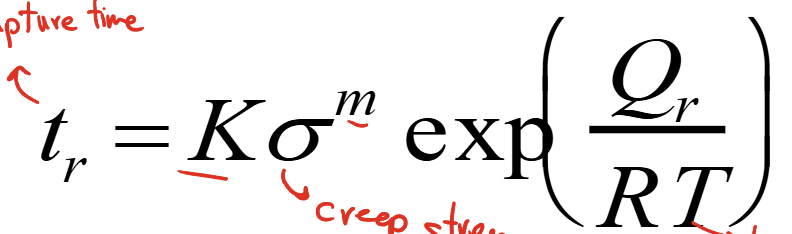
Stress-Rupture Time (tr)
How long a material survives before final creep fracture.
K and m are experimental constants
Qr is the activation energy for rupture → the lower the activation energy, the faster to rupture (positive)
Larsen-Miller (LM) Parameter
Materials and experiments with similar LM parameters should have similar creep rupture data → standardizes creep.
A and B are material specific parameters
T in kelvin
t is time to stress rupture in hours

LM Chart
These can be used to find the LM parameter of a component at a specific stress. The axes are stress(MPa) vs. LM parameter (it usually just gives you the equation)
Creep Resistant Materials
Materials with high melting temps e.g. superalloys and ceramics. Creep happens at temps at least 40% above the melting temp.

Stress Corrosion Cracking (SCC)
Cracks can be caused by the stress created from a material corroding which can lead to failure well below yield strength (expected failure)
Tensile stress + susceptible material (weak spots in materials like GBs) + corrosive environment = premature failure
How is SCC identified?
By examining the fracture surface you will see deep, narrow, highly branched cracks, they can be intergranular or transgranular.
Impact of SCC
SCC results in pitting on the materials surface which behaves as a sharp stress-raiser, these pits grow into cracks due to the corrosive environment and lead to fracture
Fatigue Loading
Alternating type of load i.e. bending something back and forth; force applied may be larger or smaller than the yield strength. Is modelled as a wave function of applied tensile vs compressive stress over time.
e.g. constant depressurizing and repressurizing of the cabin of an airplane

Fatigue
Failure of a material due to repetitive/cyclic stress. Cyclic stress lowers the strength of the material below its normal yield strength. A portion of the stress must be tensile for fatigue to occur because only tensile force helps crack propagation
Fatigue Failure Sequence
Repeated loading causes small local deformation → microscopic cracks form → cracks propagate due to the tensile force → reduction of load bearing area → sudden final fracture
Stress Amplitude
Magnitude of the stress fluctuation, amplitude of the fatigue function

Mean Stress
The vertical shift of the wave with respect to the x axis. Average stress applied (compressive vs. tensile). If mean stress is tensile this will give the best likelihood of rupture since more tensile stress is applied and that means crack propagation.
Having the whole wave function in the tensile section (mean stress >= amplitude) gives you a tensile failure.

Stress Ratio
Ratio of max stress applied to min stress applied. Describes the type of fatigue cycle:
R=-1 → reversed
R=0 → stress goes from 0 to max
0<R<1 → stress is always tensile

Stages of Fatigue Failure
Crack initiation - usually forms at surface defects, sharp corners, grain boundaries, inclusions, etc. (due to stress concentration)
Crack propagation - striated fracture surface, the more striations then the more cycles occurred; one striation per load cycle
Sudden fracture due to load bearing area decreasing
**bigger crack propagation signifies a ductile material

Fatigue Tests (S-N curves, stress vs. number of cycles)
Tells us how many cycles a material can survive at a specific load

Endurance Limit
If kept at a specific low load, some materials are theoretically undergo infinite cycles of a fatigue test (infinite fatigue life).
Steels: 50% tensile strength
Other metals: 30-40%
Miner’s Rule
You can use this to find how much ‘life’ a part has left after undergoing a certain amount of cycles at a specific load.
