Finishing Up CTT & Threats to Psychometric Quality 1 (9/23/26)
 Call Kai
 Learn
Learn Practice Test
 Spaced Repetition
 Match
Match Flashcards
 Knowt Play
1/35

There's no tags or description
Looks like no tags are added yet.
Name | Mastery | Learn | Test | Matching | Spaced | Call with Kai | Chat |
|---|
No analytics yet
Send a link to your students to track their progress
36 Terms
Non-cognitive item analysis based on CTT
Reliability, item total correlation, item variance (SD), item mean, item-criterion correlation, non response rate
Cognitive item analysis based on CTT (only for binary data)
Reliability, item difficulty, item discrimination index, distribution of responses, point biserial correlation (or biserial correlation)
Item-scale correlation (item-total correlation) for non-cognitive analysis
Correlation between score in the item and total score of the scale (we want high correlations)
Item variance for non-cognitive analysis
Not small
Item means for non-cognitive analysis
Not too high and too low
Reliability for non-cognitive analysis
Acceptable: more than 0.7
Respectable: more than 0.8
Good: more than 0.9
Non-response rate for non-cognitive analysis
0 or very small
Item-criterion correlations for non-cognitive analysis
No clear standard but at least more than .2
Personality tests
Item variance should not be too small and item means should not be too low or too high
Survey items
In some cases, small variance, too high/low mean are okay
Negative item discrimination
People who don’t have the appropriate knowledge were able to correctly answer the question, but people who did have the appropriate knowledge were unable to correctly answer the question
The reliability that should be used for cognitive items (binary data)
KR-20 because the data is dichotomous

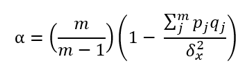
What does m stand for in the KR-20 equation?
number of items

What does pj stand for in the KR-20 equation?
Proportion of people who correctly answer the item j

What does qj stand for in the KR-20 equation?
Proportion of people who did not correctly answer the item j

What does σ2x stand for in the KR-20 equation?
Variance of the test scores
Item difficulty for cognitive items (binary data)
The number of ppl who get a particular item correct. Ex) 84 out of 100 people correctly answered = 84%. Too low (0 - 0.2) or too high (0.9 - 1) is not good. Around 0.5 would be desiriable
Item discrimination for cognitive items (binary data)
Difference in item difficulty between high performers and low performers. 30 or more than 30 would be better but more than 20 is acceptable
Steps for calculating item discrimination for cognitive items (binary data)
Create high & low performer groups (any % between 25% and 35%) using scores of the test
Calculate the % of people who correctly answered of each group
Calculate “high performer %” and “low performer %”
Point biserial correlation for cognitive items (binary data)
Correlation between performance on the item and performance on the total test (technically performance on the total test excluding the item)
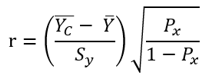
Standard for point biserial correlation
Depends on the type of construct but at least should be more than 0.2. For distractors, correlation between total scores and choice of the distractor (select 1 not select 0)
Distractors
Wrong options in tests
Good item distribution
Like an inverted triangle
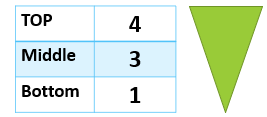
Bad item distribution
Like a triangle

Good distractor
Point biserial correlations for the two distractors are negative; the two distractors worked well.

Bad distractor
Point biserial correlation for the distractor c) worked well but the distractor b) did not work well. As the biserial correlation for distractor b) is positive and relatively large, higher ability people tend to choose choice b)

Response bias
Tendencies for participants to respond inaccurately or falsely to questions. Includes acquiesence, extremity & modesty, social desirability, malingering, random/careless responding, & guessing
Test bias
Systematically obscures differences between groups (and between people from different groups). Includes construct bias and predictive bias
Acquiesence
Consistently endorsing items w/out much regard for their content (“yea-saying”) and consistently rejecting items w/out much regard for their content (“nay-saying”). Caused by cultures and other factors such as personality traits. Would increase internal correlations & correlations between tests. May harm reliability & validity
Extremity & modestry
Tendency to overuse “extreme” response options and underuse “extreme” response options, respectively. Implications similar to those for acquiescence bias. Creates ambiguity in who truly has high (vs low) levels of the construct being measured
Social desirability
Tendency to respond in a way that is social appealing, regardless of one’s true psychological characteristics. Technically this is not “fake good” but there is overlap
Subdimensions of social desiarbility
Impression management and self-deception
Item transparency
How easily test takers understand what the item is assessing. Too high and low of this is not good. Can artificially inflate (or deflate) test scores. Can’t tell who truly has a high level of the construct. Can harm predication/decisions based on the test result.
Malingering
Tendency to respond (intentionally) in a way that suggests psychological problems, regardless of one’s true psychological characteristics; “faking bad.” Most likely to occur when being perceived as having problems would benefit the respondent (e.g., disability evaluation, worker’s compensation claims)
Random/careless responding
Answering questions in random, semi-random or simply careless fashion. Occurrence estimates 1-10% of respondents, though varies by context and scope of randomness. Most likely when not motivated to be thoughtful/careful (anonymity, feelings of coercion). Score isn’t meaningful/interpretable. In research context, night attenuate or spuriously inflate effects
Guessing
For tests with “correct” answers. When respondent motivated to select correct answers. Eg) cognitive ability test