CFA Vol-9 Portfolio Management
 Call Kai
 Learn
Learn Practice Test
 Spaced Repetition
 Match
Match Flashcards
 Knowt Play
1/87

There's no tags or description
Looks like no tags are added yet.
Name | Mastery | Learn | Test | Matching | Spaced | Call with Kai | Chat |
|---|
No analytics yet
Send a link to your students to track their progress
88 Terms
If the investment horizon for this bond is one year and the payoff then is $1, the return on this bond can be written as the future payoff minus the current payment relative to the current payment:



Risk-averse investors demanding a large equity risk premium are most likely expecting their future consumption outcomes and equity returns to be: (Positvely corrolated, negatively corrolated, uncorrolated)
Positively corrolated
The Sharpe ratio, SRP, is calculated for any portfolio, either actively managed or a benchmark, using the formula:

The information ratio of an actively managed portfolio, IR, is calculated by dividing the active return by active risk:
Not: Aktive risk = Rp-Rb

Tek Faktörlü Model (CAPM benzeri):

Using the optimal active weights in Equation 11 and forecasted active security returns in Equation 10, the expected active portfolio return is
Bu formüllerdeki BR (Breadth - Kapsam), bir portföy yöneticisinin yıl boyunca aldığı birbirinden tamamen bağımsız, korelasyonsuz ve benzersiz yatırım kararlarının (bahislerin) sayısıdır .

TC Nedir?
Kisitlamalarin portföy yöneticisinin yeteneğini ne kadar "törpülediğini" ölçen parametreye Transfer Katsayısı (TC) denir.
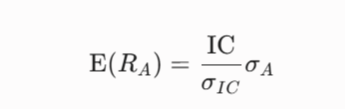
Kısıtlamaları da formüle dahil ettiğimizde, beklenen aktif getiri E(RA)
TC (Transfer Coefficient): Kısıtlamaların portföye yansıma verimliliği.
IC (Information Coefficient): Yöneticisinin tahmin becerisi/isabet oranı.
BR (Breadth): Portföydeki bağımsız bahis/karar sayısı.
σA (Active Risk / Tracking Error): Portföyün aldığı aktif risk.

Employing this optimal level of aggressiveness leads to a maximum possible value of the constrained portfolio’s squared Sharpe ratio: (TC ve IC`li olan Sharp ratio)

Beklenen getirinin revizyonu
What measures greatest consistency of active return?
Information ratio
İşte aktif yönetim teorisinin en önemli özelliklerinden biri olan, metnin yarım bıraktığı o meşhur kareler toplamı formülü (Grinold-Kahn / Treynor-Black mantığı) devreye girer:

Redemption basket
AP'nin yeni ETF payları yaratmak istediğinde kullandığı sepettir. Bu durum genellikle borsada ETF'e olan talep çok yüksek olduğunda ve ETF fiyatı NAV'ın üzerine çıktığında (Premium/Primli işlem) gerçekleşir.
Creation basket
AP'nin elindeki ETF paylarını itfa etmek (nakde/hisseye çevirmek) istediğinde kullandığı sepettir. Bu durum genellikle borsada ETF'e olan talep düştüğünde ve ETF fiyatı NAV'ın altına indiğinde (Discount/İskontolu işlem) gerçekleşir.
ETN Exchange traded notes
ETN`ler ihraççı bankanın yatırımcıya belirli bir endeksin getirisini ödemeyi taahhüt ettiği teminatsız borç senetleridir (unsecured debt obligations);
borsada ETF'ler gibi işlem görüp ihraç/itfa (creation/redemption) mekanizmasına sahip olsalar da arkalarında dayanak bir varlık (hisse, tahvil vb.) barındırmazlar.
Banka aniden iflas ederse, teorik olarak risk %100'dür ve ETN'ler tamamen değersiz (worthless) kalabilir
ETF authorized participants create and redeem ETF shares in the (Primary or secondary)?
Primary
ETF (primary/secondary) market trades are transactions between buyers and sellers of existing ETF shares?
Secondary
Factor (smart beta) ETFs
benchmarked to an index created with predefined rules for screening and weighting constituent holdings whose index rules are structured around return drivers, or factors, such as dividend yield, size, value, and momentum.
The APT is similar to the CAPM, but the APT makes less strong assumptions than the CAPM. The APT makes just three key assumptions:
A factor model describes asset returns.
With many assets to choose from, investors can form well-diversified portfolios that eliminate asset-specific risk.
No arbitrage opportunities exist among well-diversified portfolios.

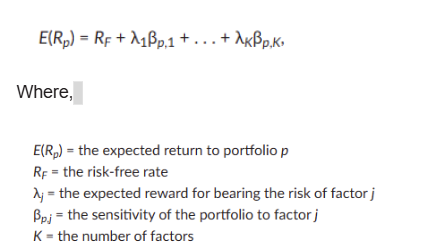
According to the APT, if these three assumptions hold, the following equation holds:
In a macroeconomic factor model,
the factors are surprises in macroeconomic variables that significantly explain returns;
in the example of equities, the factors can be understood as affecting either the expected future cash flows of companies or the interest rate used to discount these cash flows back to the present.
In a fundamental factor model,
the factors are attributes of stocks or companies that are important in explaining cross-sectional differences in stock prices.
Among the fundamental factors that have been used are the book-value-to-price ratio, market capitalization, the price-to-earnings ratio, and financial leverage.
In a statistical factor model
the factors are actually portfolios of the securities in the group under study and are therefore defined by portfolio weights.
An asset’s sensitivity to a factor is expressed using a standardized beta:

The decomposition of active return

Günlük TE`yi yillik yapmak icin: (tracing error)

Aylik TE`yi yillik yapmak icin: (tracing error)

Active factor risk
is the contribution to active risk squared resulting from the portfolio’s different-from-benchmark exposures relative to factors specified in the risk model.
Örnek: Benchmark'ta teknoloji sektörünün ağırlığı %20 iken, portföy yöneticisi teknoloji sektörüne %35 ağırlık verirse (yani teknoloji faktörüne karşı overweight olursa), portföyün Active Factor Risk'i yükselir. Eğer teknoloji sektörü genel olarak çöker veya uçarsa, portföy benchmark'tan çok ciddi şekilde sapar.
Active specific risk or security selection risk
measures the active non-factor or residual risk assumed by the manager. Portfolio managers attempt to provide a positive average return from security selection as compensation for assuming active specific risk.
Örnek: Diyelim ki yönetici teknoloji sektörünün ağırlığını benchmark ile tamamen aynı (%20) tuttu. Yani sektörel/faktör bazda bir risk almadı. Ancak bu %20'lik bütçeyi endeksteki gibi Apple ve Microsoft'a dağıtmak yerine, endekste hiç olmayan ya da az olan X ve Y yazılım şirketlerine yatırdı. İşte bu durumda oluşan risk Active Specific Risk'tir.
Active risk squared

Kurallara Dayalı Aktif Yönetim (Rules-Based / Alternative Indexes)
"Smart Beta" olarak da bilinir. Mekanik ve düşük maliyetli bir şekilde portföyü sürekli belirli faktörlere (Size, Value, Quality) doğru eğen (tilt), insan hatasını dışarıda bırakan sistematik endeks yapımıdır.
Actual Return formula (the one with Expected return , actual value and factor sensitivity
Burada Faktor sensitivity beta olurken, F suoris actual eksi expected value seklinde hesaplanir.

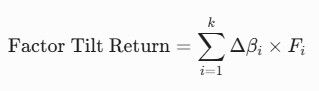
Factor tilt return formula
Beta: Portföyün i faktörüne olan hassasiyeti (Portfolio factor sensitivity/loading); Fi: faktörünün gerçekleşen getirisi (Factor return).
Active return from security selection =
Active return – Factor tilt return
Tracking error is also known as
Active risk, Yani information ratioyu bulurken böldügümüz q

Three steps of VaR
i) The first step of every VaR calculation, regardless of the VaR method used, is to convert the set of holdings in the portfolio into a set of exposures to risk factors, a process called risk decomposition.
ii) The second step of VaR estimation requires gathering a data history for each of the risk factors in the VaR model.
iii) The third step of each method is where the differences between the three VaR methods are most apparent: how each method uses the data to make an estimate of the VaR.
The parametric method of estimating VaR
is sometimes referred to as the analytical method and sometimes the variance–covariance method.
A standard normal distribution for VaR calculation is also known as a z-distribution.

The volatility of the portfolio, σp, is estimated from the following equation:

Thus, our portfolio, is estimated to have an expected return of 9.6% and a volatility of approximately 15.99%. Thus, the daily expected return and volatility are
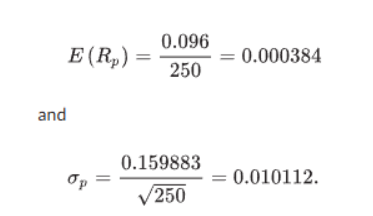

(Not: 2.33 istatistiksel olarak given number) (annual derse standart sapmayi karekök 250 ile carpiyoruz)

The historical simulation method of VaR
uses the current portfolio and reprices it using the actual historical changes in the key factors experienced during the lookback period.
Monte Carlo simulation is a method of estimating VaR
in which the user develops his own assumptions about the statistical characteristics of the distribution and uses those characteristics to generate random outcomes that represent hypothetical returns to a portfolio with the specified characteristics.
The two elements of scenario risk measures that set them apart from sensitivity risk measures are
(1) the use of multiple factor movements used in the scenario measures versus the single factor movements typically used in risk sensitivity measures
and (2) the typically larger size of the factor movement used in the scenario measures.
Incremental VaR
"Portföydeki pozisyon büyüklüklerini değiştirirsem ya da yeni bir varlık eklersem toplam VaR nasıl değişir
Marginal VaR (MVaR)
Portföydeki bir varlığın miktarını çok küçük bir oranda değiştirirsem, toplam VaR buna nasıl tepki verir
Ex Ante Tracking Error / Relative VaR (Göreceli VaR)
Yatırım portföyümün performansı, takip ettiği gösterge endeksten (benchmark) ne kadar sapabilir?
Conditional VaR (CVaR)
VaR sınırı aşılırsa, ortalama kayıp ne kadar olur?
Full revaluation of securities (VaR)
Kriz ortamlarinda varliklarin riskini ölcmek
In an environment of decreasing interest rates, the bond with the (lowest/highest) duration will have the greatest positive return.
Highest ( Formule bakarsan modified duration ters calisiyor)

Look-Ahead Bias
Bir şirketin mali dönemi 31 Aralık'ta bitebilir ancak bilançonun hazırlanıp denetlenmesi ve Kamuyu Aydınlatma Platformu'na (KAP) veya SEC'e bildirilmesi haftalar, hatta aylar sürer. Modelde 31 Aralık günü, o gün biten dönemin kârını (EPS) kullanırsanız, gelecekteki bilgiyi bugüne çekmiş olursunuz (Yanılgı).
Data snooping
Önceden kurulmuş hipotezleri (prior inference) test etmek yerine, verinin içine dalıp istatistiksel olarak anlamlı bir sonuç bulana kadar analizleri, değişkenleri ve veri setini evirip çevirme hatasıdır.
Çözüm: Keşfedilen yeni bir alpha faktörünün gerçekten değer yaratıp yaratmadığını kabul etmek için çıtayı yükseltmek (Örn: t-istatistig˘i>3.0 şartı koşmak).
The Sharpe ratio is effected or unaffected by the addition of cash or leverage in a portfolio.
Unaffected
Nakit / Kaldıraç: Yatırımcının risk iştahına göre riski ve getiriyi doğrusal olarak ölçeklendirmesini sağlar. Sharpe Ratio'yu yükseltmez veya düşürmez.
Sharpe Ratio'yu Gerçekten Ne Yükseltir? Sharpe Ratio'yu artırmanın tek yolu, portföye korelasyonu düşük ve risk-getiri profili iyi olan yeni riskli varlıklar ekleyerek çeşitlendirme (diversification) yapmak veya doğru varlık seçimiyle (α) riskli portföyün kendisini (P) daha etkin hale getirmektir.
Sharpe ratio of an actively managed portfolio is

The optimal active portfolio is the portfolio with the highest information ratio, the ratio of active return to?
Active risk
Martket maker
ETFs trade in the secondary market throughout the course of the day at the then-current market price. In that regard, they are like any other stock in which buyers and sellers are matched.
Authorized participant
There is a primary market for ETFs in which there is a creation and redemption process for shares. Here, the arbitrage gap is reduced to a narrow band to ensure that the price of the ETF and the underlying securities trade around a barrow band
ETF sponsor
If, for example, ETF shares are being created, an intermediary receives the basket of in-kind securities at settlement.
Contrarian strategy
finans piyasalarında genel piyasa eğiliminin (sürü psikolojisinin) tam tersine hareket etmeyi esas alan bir yatırım yaklaşımıdır.
APT (does or does not) indicate the number of factors or their identity.
Does not
breach
ihlal, cigneme, uymama
stale data.
güncelliğini yitirmiş, eski veya güncel olmayan veri demektir.
The difference between nominal and inflation-linked bond yields reflects the expectations of and uncertainty about
the quantity of goods and services investors will be able to consume in the future.
Corporate profitability is considered (a leading, or lagging?) indicator of the business cycle.
Leading
Household products industry
Ev Temizlik ve Hijyen Ürünleri: Çamaşır deterjanları, yumuşatıcılar, bulaşık deterjanları, yüzey temizleyiciler, çamaşır suları ve dezenfektanlar.
Kağıt Bazlı Tüketim Ürünleri (Paper Products): Tuvalet kağıdı, kağıt havlu, peçete, mendil vb.
Ev Bakımı ve Oda Kokuları: Hava tazeleyiciler, böcek ilaçları (pestisitler), mobilya cilaları ve ayakkabı bakım ürünleri.
Mutfak ve Depolama Ürünleri: Alüminyum folyo, streç film, çöp poşetleri, pişirme kağıtları.
Information ratio (Active return ve active risk li olan)
Active return/ Active risk
Information Coefficient (IC) neyi ölcer
yöneticinin dönem başında varlıkların getirilerine ilişkin yaptığı tahminler (ex-ante expected returns) ile dönem sonunda gerçekleşen getiriler (ex-post realized returns) arasındaki korelasyondur.
Kapsamı: -1 ile +1 arasında değer alır.
IC = 1: Mükemmel tahmin yeteneği.
IC = 0: Hiçbir tahmin yeteneği yok (yazı-tura atmakla aynı).
IC < 0: Yanıltıcı tahminler (tahminlerinin tam tersi gerçekleşiyor).
Information Ratio (IR) Nedir?
Information Ratio (IR), bir portföy yöneticisinin aldığı risk birimi başına ürettiği fazladan getiriyi (aktif getiri / alpha) ölçen bir başarım (performans) metriğidir.

. Real short-term interest rates are positively related to both xx GDP growth and the volatility of real GDP growth.
Real (Nominal GDP - Inflation)
Stock prices are a function of expected cash flows discounted by inflation expectations, the uncertainty of future inflation, and the equity risk premium, among other factors. Holding all else equal, a decline in the uncertainty of future inflation would result in (lower/higher) discount rates and (lower/higher) valuations.
Lower Discount rates, higher
Discretionary goods.
Istege bagli tüketim mallari
Staple goods.
Zorunlu tüketim mallari
Break-even inflation (BEI)
The difference between the yield on, for example, a zero-coupon default-free nominal bond and on a zero-coupon default-free real bond of the same maturity

Sharpe ratio maximizing level formula:

Total expecting holding period cost formula: (For ETF)
Total expected holding period cost = Annual management fee + Round-trip trading commissions + Bid–offer spread on purchase/sale.
e the expected return of an asset in a macroeconomic factor model is given by the xx?
Intercept term. (Yani y li x li formulde degiskenlerin sifir olarak varyasildigi ilk sabit terimin alindigi durum)
A (pure) factor portfolio would have a sensitivity of 1 for that factor and a sensitivity (or weight) of xx, for all other factors.
0
The distribution of returns is flatter in a non-recession environment, it implies that extreme outcomes are xx to occur during the non-recession regime.
More likely
Multivariate Normal Distribution (Çok Değişkenli Normal Dağılım)
Mantık: Birden fazla rastgele değişkenin (ör. faktör getirilerinin) birlikte normal dağılım sergilediğini varsayar.
CFA Sınavı İpucu: Simetriktir ve ince kuyruklara (thin tails / mesokurtic, excess kurtosis = 0) sahiptir. Aşırı piyasa şoklarını veya kriz anlarındaki uç değerleri (tail events) underestimate eder (küçümser). Gerçek finansal piyasa getirilerini modellemekte yetersiz kalabilir
It allows estimating a smaller number of parameters.
Multivariate Student's t-Distribution (Çok Değişkenli Student's t Dağılımı)
Mantık: Faktör getirilerinin Student's t-dağılımı izlediğini varsayar.
CFA Sınavı İpucu: Normal dağılıma kıyasla kalın kuyruklara (fat tails / leptokurtic, yüksek basıklık) sahiptir. Piyasadaki uç değerlerin, krizlerin ve ekstrem olayların (extreme tail risk) gerçekleşme olasılığını daha gerçekçi şekilde modele yansıtır.
Piyasa krizlerini, aşırı oynaklığı veya VaR (Value at Risk) gibi kuyruk riski odaklı analizleri simüle ederken Student's t-distribution her zaman Normal Dağılım'a göre daha uygun ve ihtiyatlı bir tercihtir.
A statistic/portfolio-based approach is most suitable when the portfolio of loans is short-term (and therefore fairly static), granular, and homogeneous, like in this case.
Statistic
A (statistic or portfolio?)-based approach is instead more suitable when the portfolio of loans is medium-term/dynamic and therefore subject to change over time.
Porfolio
XX is equal to the yield spread between a real bond and a nominal bond of the same maturity.
The break even inflation rate
Ex ante tracking error
to measure the degree to which clients’ current portfolios might underperform their benchmarks in the future.
VaR (take/or take not) into account liquidity.
Take not
Surplus at Risk
Varlıkların, yükümlülüklerin gerisinde kalma (underperform etme) riskini en iyi ölçen metrik Surplus at Risk metriğidir.
What happens if the future is different from the past?” is a problem most relevant for which investment strategy evaluation technique?
Backtesting