Data analysis: graphs
 Call Kai
 Learn
 Practice Test
 Spaced Repetition
 Match
 Flashcards
 Knowt Play
1/5

There's no tags or description
Looks like no tags are added yet.
6 Terms
Tell me about tables
Good for raw data and summary statistics (means, SDs).
Always include clear row/column headings and units.
Tell me about bar charts
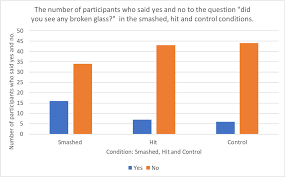
Use for categorical data (discrete)
categories on x-axis and frequency or mean score per category on y-axis
bars must be separated
operationalised variables must be included in tables and titles
Tell me about histograms
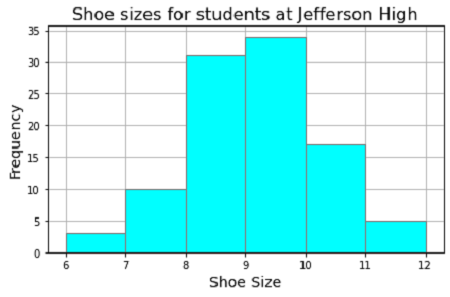
Use for continuous data (can represent an infinite number of possible values)
grouped into equal intervals (bins). Y-axis represents the frequency of each interval
Bars touch.
Useful to view distribution shape (normal/skew)
need title, x-axis, y-axis and accurate plotting
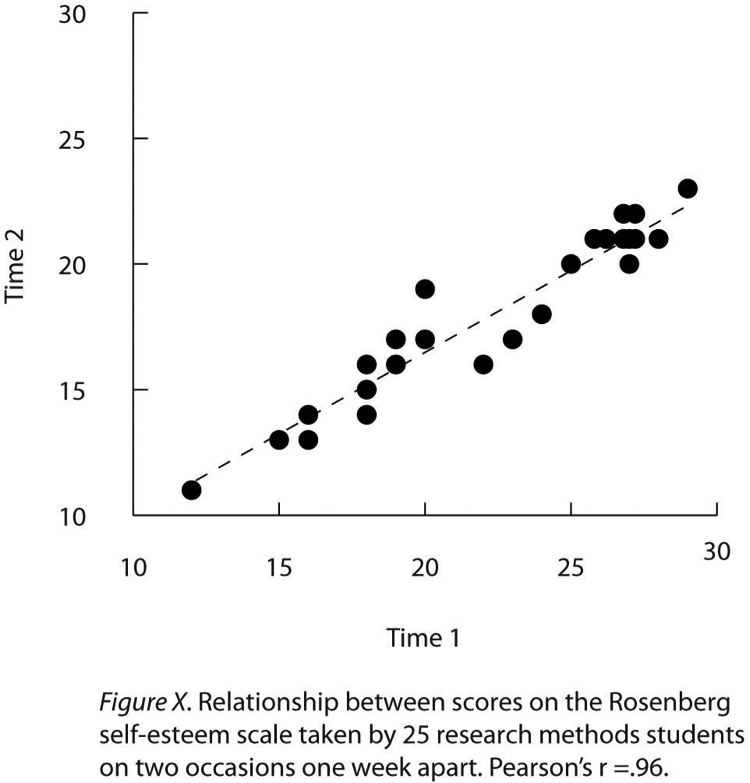
Tell me about scattergraphs (scattergrams)
Used to show correlations - whether two co-variables are related
both the co-variables need to be in numerical form on a scale and a title
Useful for seeing direction, strength, and outliers
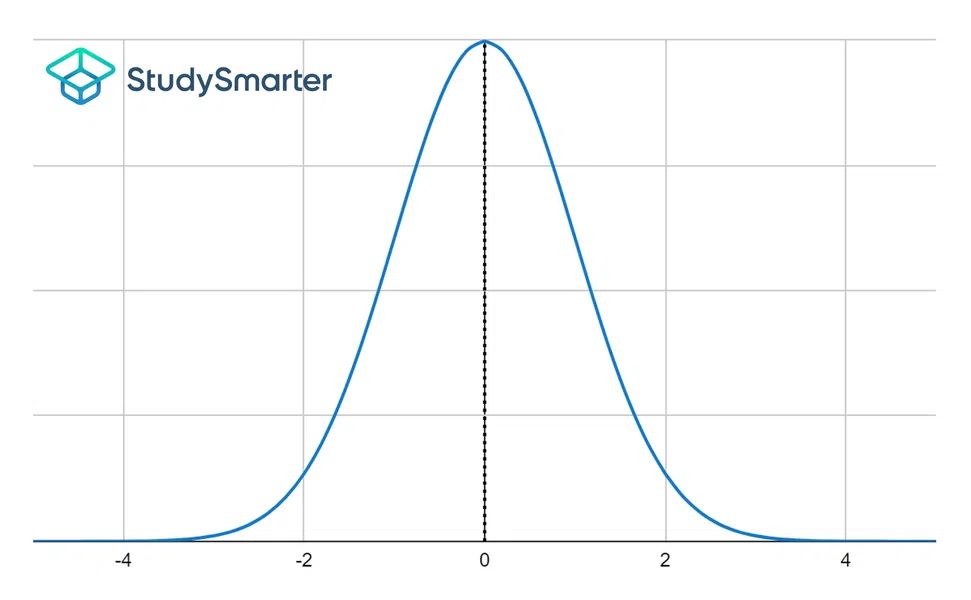
Tell me about normal distribution
Symmetrical bell shape
Mean = median = mode. They are all at the peak of the curve
Most scores cluster around the centre; the tails are equal both sides.
Many psychological measurements approximate normal distributions.
Tell me about skewed distribution
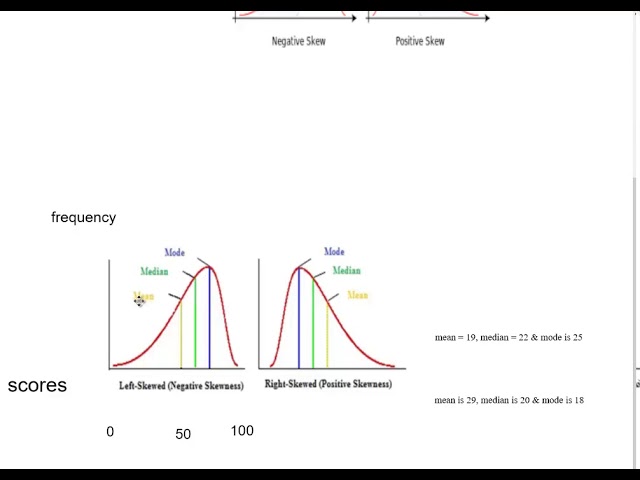
Negative (left) skew: long tail to the left. Typical order: mean < median < mode (the peak). This occurs when there are more high scores than low scores and so distribution is concentrated to the right of the graph
Positive (right) skew: long tail to the right. Typical order: mode < median < mean (the lowest),(mean pulled toward the tail). This occurs when there are more low scores than high scores and so distribution is concentrated to the left of the graph