ecology
 Call Kai
 Learn
 Practice Test
 Spaced Repetition
 Match
 Flashcards
 Knowt Play
1/457

There's no tags or description
Looks like no tags are added yet.
458 Terms
ecology
nested heirarchy
the study of the distribution and abundance of organisms and their interactions
the scientific study of interactions between organisms and their environment
nested hierarchy of disciplines

refers to a scientific endeavour, not environmental activism
other kinds of science that intersect
genetics
most concerned with studies of populations → population ecology
isolation
ancestry
biogeography
spatial distribution of organisms
considers how features of landscape influence where species are found and how that might be dependent on history
overlaps with ecology
physical and chemical processes
intersects with
geomorphology
hydrology
biogeochemistry
studying how organisms in aggregate contribute to physical and chemical processes of the environment
levels of organisation
individuals
populations
species may be one or many populations
communities
populations of multiple species
ecosystems
includes the abiotic and biotic
challenges to studying ecology (2 things) and defining evolution
historic contingency
ecological patterns are a product of the past
shaped by first nations and modern land use, for example
recreating conditions outside of a lab is very tricky
evolution
what happens over time as ecological constraints and processes operate
changes in genotypes and phenotypes of populations
challenging to predict
forced through actions of geological and climatic changes at long time scales
but also weather and geomorphology at fine scales
everything in an environment changes rapidly (from above)
genetic changes mean that organisms themselves change (from below)
ecology + use of theory
the close observation of nature
roles for theory and empiricism in ecology
inductive
observe patterns and induce principles
can’t use core assumptions unlike other fields
instead, ‘pattern,’ and ‘process,’
observing patterns and seeking to understand ho they occurred
experimentation
much ecological science is merely observational
reliant on patterns of correlation
tend to start from exploratory studies and progress to confirmatory hypothesis testing
events in the natural world are interconnected
even species that do not interact directly can be connected by shared environmental features
case study: amphibian declines


early ecological views
there is a, ‘balance of nature,’ in which natural systems are stable and tend to return to an original state after disturbance
each species plays a distinct role in that balance
ecologists now recognise that natural systems do not necessarily return to their original state after a disturbance, and seemingly random perturbations can play an important role
ecologists must select appropriate scales of study
spatial scales:
small → soil microorganisms
large → atmospheric pollutants
temporal scales:
short → leaf response to sunlight
long → species change over geological time
ecologists study interactions across many levels or organisations

an ecological hierarchy example: + landscape + biosphere
an individual seastar
is part of a population of seastars
which is one of the interacting populations of different species found in a community
or an ecosystem if we are including the abiotic components
which is nested within a landscape composed of multiple ecosystems
e.g. land and ocean
the biosphere includes all of earth’s ecosystems
all living systems change over time
define four things
evolution: change in genetic characteristics of a population over time
adaptation: a characteristic that improves survival or reproduction
natural selection: individuals with certain adaptations tend to survive and reproduce at a higher rate than other individuals
if the adaptation is heritable (has a genetic basis), the frequency of the characteristic may increase in a population over time through natural selection
ecologists evaluate competing hypotheses about natural systems with observations, experiments, and models
no single approach works in all situations, so ecologists use a variety of methods
observational studies in the field
controlled experiments in the laboratory
experiments in the field
quantitative models
ecologists
make observations and ask questions
use previous knowledge and theory to develop hypotheses
evaluate hypotheses by experimentation, observational studies, or quantitative models
use the results to modify the hypotheses, pose new questions, or draw conclusions about the natural world
habitat
a description of the places where you might find a particular organism
can be defined broadly or otherwise
in rainforests vs.
canyon walls but not floors
you can have a habitat without a focal organism
environment
the phenomena that surround an organism that potentially interact with it
can be abiotic
temperature
light
or biotic
trampling by hooves
predation
disease
more mechanistic than habitat → interactions with organism
you cannot have an environment without a focal organism
can be characterised with
resources (!)
can be consumed
thereby preventing other orgnanisms from using
shells for hermit crabs, food, even CO2
conditions (!)
physicochemical features that cannot be consumed
experience/use does not affect experience for another organism
oil pH, temperature, arsenic concentration in water
why is habitat less satisfactory to explain species distribution than its environmental response?
habitat doesn’t account for interactions between species
how might organisms be affected by conditions and resources?

environmental tolerance

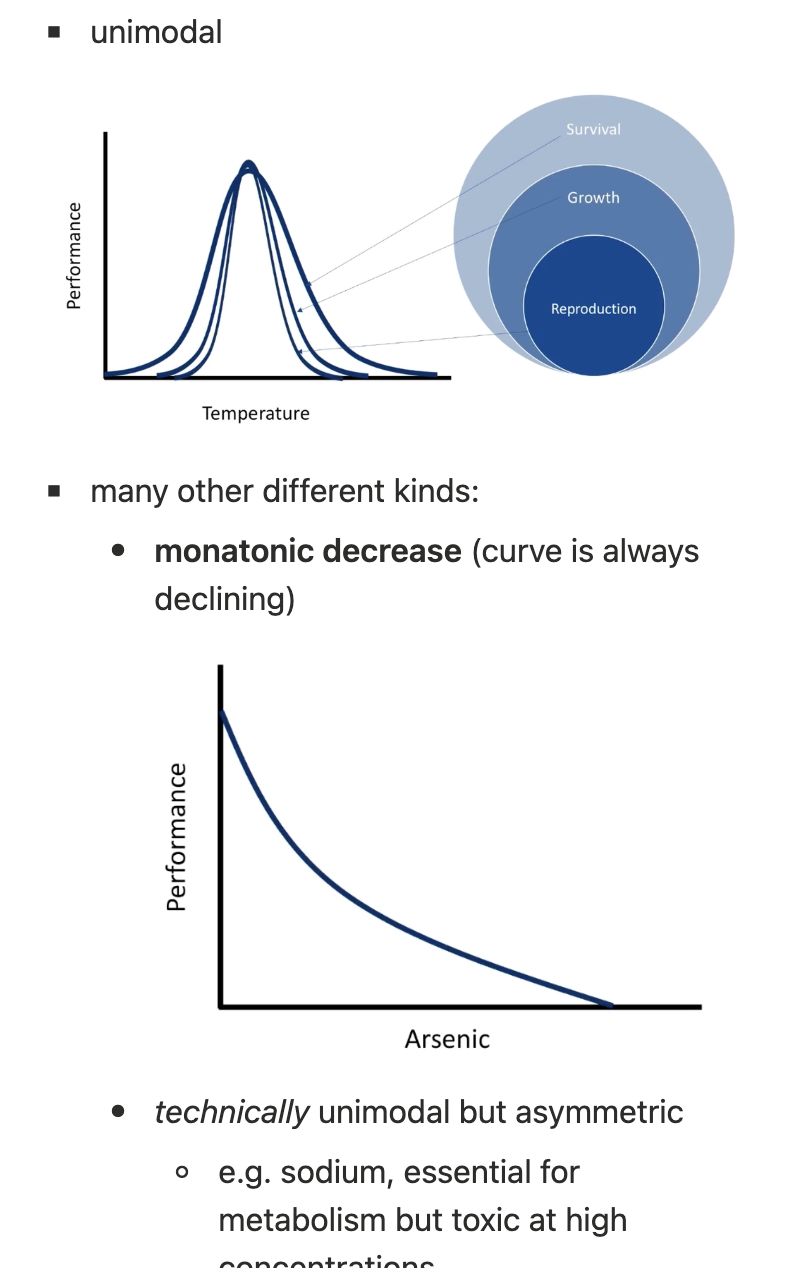
an environmental response curve
+ DIFFERENT kinds (NAME!)

substitutability
an essential resource → hermit crabs cannot substitute for their shells with rocks
a substitutable resource → elements of a hermit crab’s diet
perfectly → barely substitutable
liebig’s law of the minimum

Life stage dependency
organisms’ interactions with conditions and resources may be life-cycle dependent
seedlings are more sensitive to the environment than adult trees
fewer resources to draw on
germination of seeds can respond to particular stimuli like heat or light → response determined by life cycle stage
mayflies
most of lifespan as juvenile nymph → obligate aquatic animal
then obligate terrestrial as an adult
different conditions and requirements depending on lifestage
niches in 1 dimension
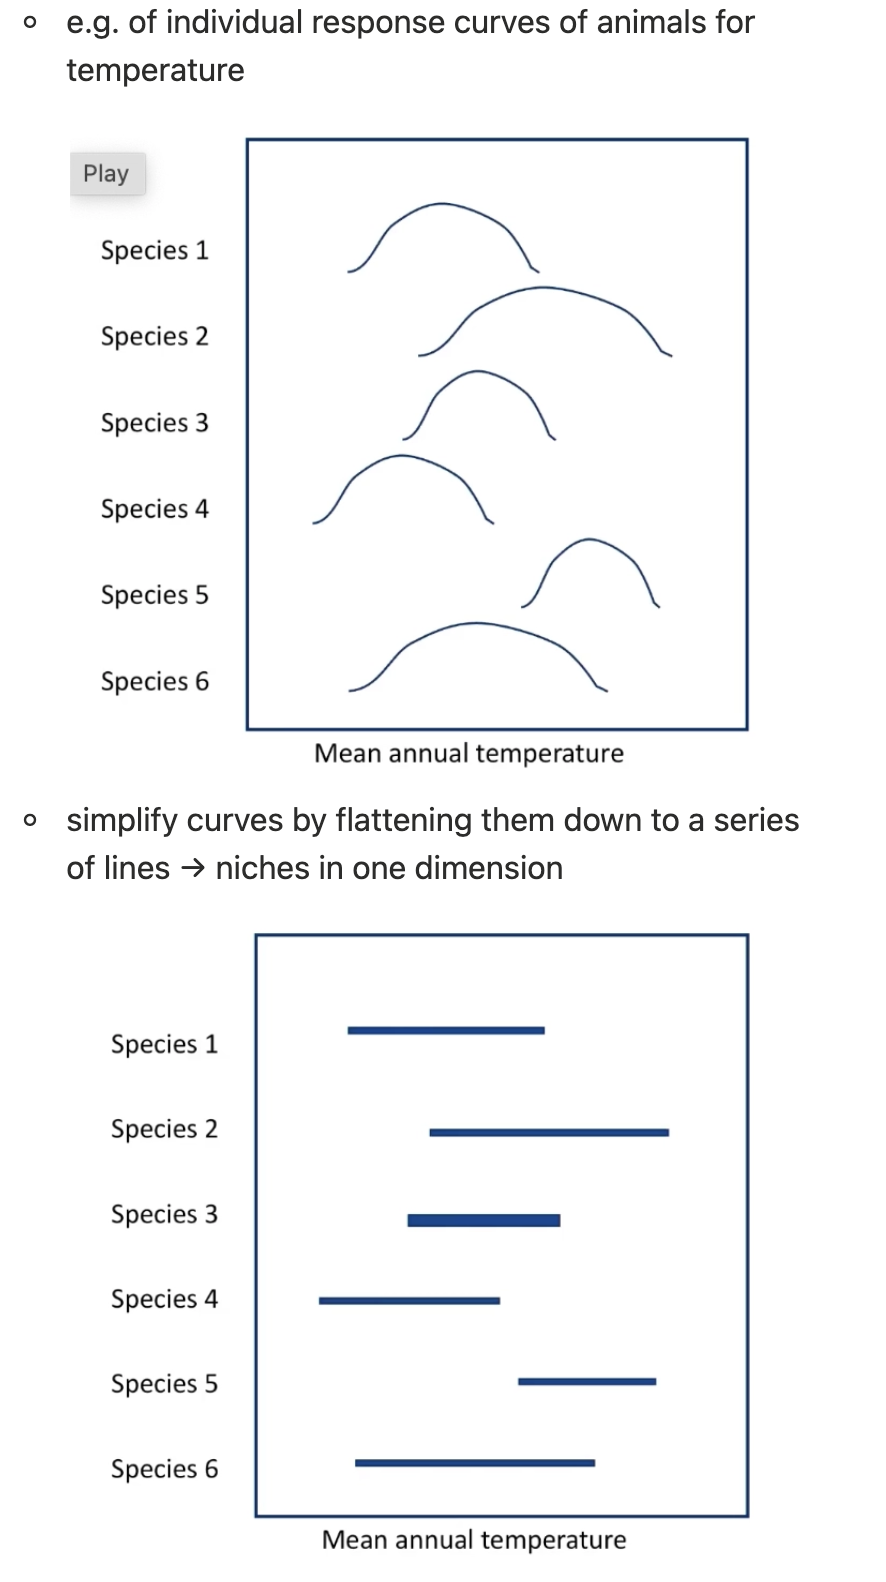
niches in two dimensions

niches in three dimensions

the n-dimensional hypervolume
how do sessile and mobile organisms differ in their responses to environmental conditions and resources?
n = the number of factor s defining the niche
hyper = many dimensions
gives us a concise way to see the requirements to sustain the population of an organism
gives us a basis to think about where species may be found
how do sessile and mobile organisms differ in their responses to environmental conditions and resources?
mobile organisms move away, sessile organisms adapt
niche partitioning

landscapes exhibit environmental gradients

mapping the niche

or maps to link things like niche and species distribution

how might organisms be found in locations that are suboptimal?
disturbances in the environment (variation through time)
dispersal barriers
zone of tolerance is wider than the optimum conditions for survival. organisms can prioritise some metabolic processes over others to maintain survival
realised niche

some species may have mutually positive interactions that create realised niches

arboretums: planting outside the native range
most things can grow way outside their range! especially if
most eucalypts have range <1% of Australia
one guy growing hundreds of species in currency creek and managing to grow them all
most things can grow way outside their range! especially if they are moved from harsh to easier (temperate) conditions
habitat saturation leads to
all space is occupied
disperal → individual organisms disperse away from their place of birth
evolutionary advantage to avoid resource competition, even with mother
dispersal limitation → they can’t get everywhere
causes… x of the realised niche

source and sink dynamics

fundamental
disturbances in the environment (variation through time)
dispersal barriers
zone of tolerance is wider than the optimum conditions for survival. organisms can prioritise some metabolic processes over others to maintain survival
the data we have is only partly correlated with the direct gradients
annual rainfall or mean temp at nearest weather station
indirect gradients
some of these are highly imperfence representations of the direct gradients to which species respond
not all are captured → can lead to innaccuracies mapping niches
such analyses result in predictoins of suitability across the landscape but these may be incertain
resources can be roughly subdivided
qualitative
kinds of resource
types of fruit for frugivores
grass vs shrubs for herbivorous mammals
leads to adaptations like neck length in giraffes
position on tree
tree creepers vs. leaf gleaning vs seed foragers
quantitative
amounts of resource
supply of water
supply of nutrients
body size a proxy for niche?


population !
abundance !
populations are dynamic entities that vary in size over time and space

what processes influence population size?

populations can grow exponentially when conditions are favourable, but exponential growth cannot continue indefinitely

geometric growth
what happens to growth rate?
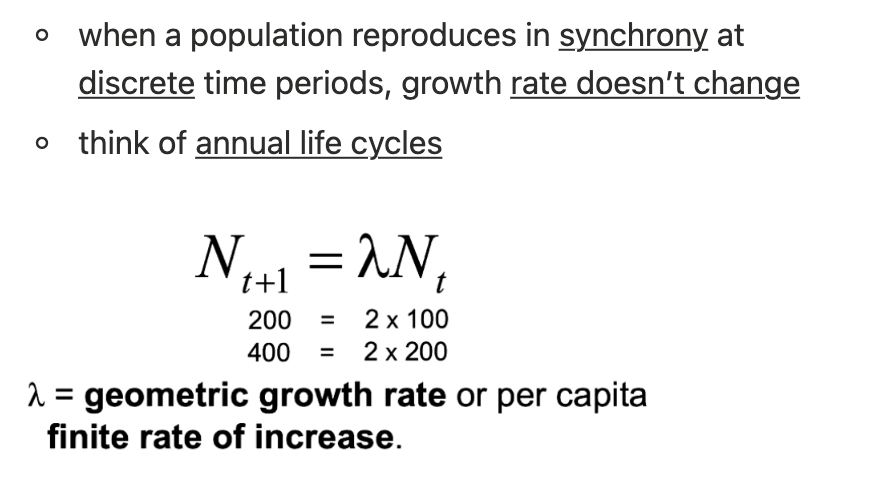
exponential growth* !!

graph shapes

calculating exponential growth
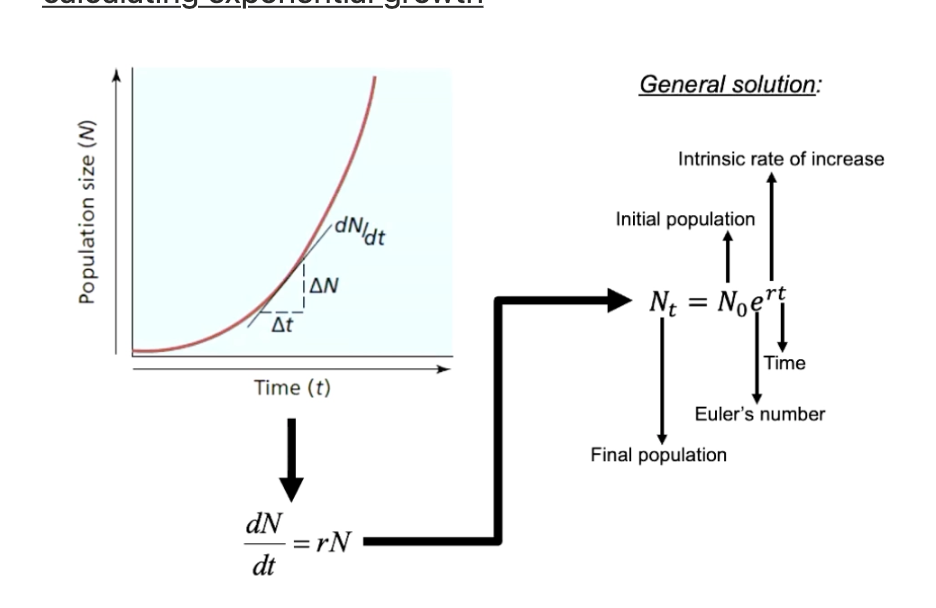
example calculation*

what growth curves look like for different values of landa and r

where do we find exponential growth/decline?

what if we don’t know what r is?

how do we measure changes in population size?
census
abundance eastimates
quadrats/transects
mark-recapture (practical 3!)
cover, biomass
what are the assumptions of exponential growth models? (!)
no immigration or emigration (closed population)
no differences between individuals
constant births (b) and deaths (d)
under ideal conditions, r= but
under ideal conditions, r > 0 for all populations
but conditions rarely remain ideal, and r fluctuates over time
density-independent factors

density-dependent birth and death rates
unless

population regulation by…

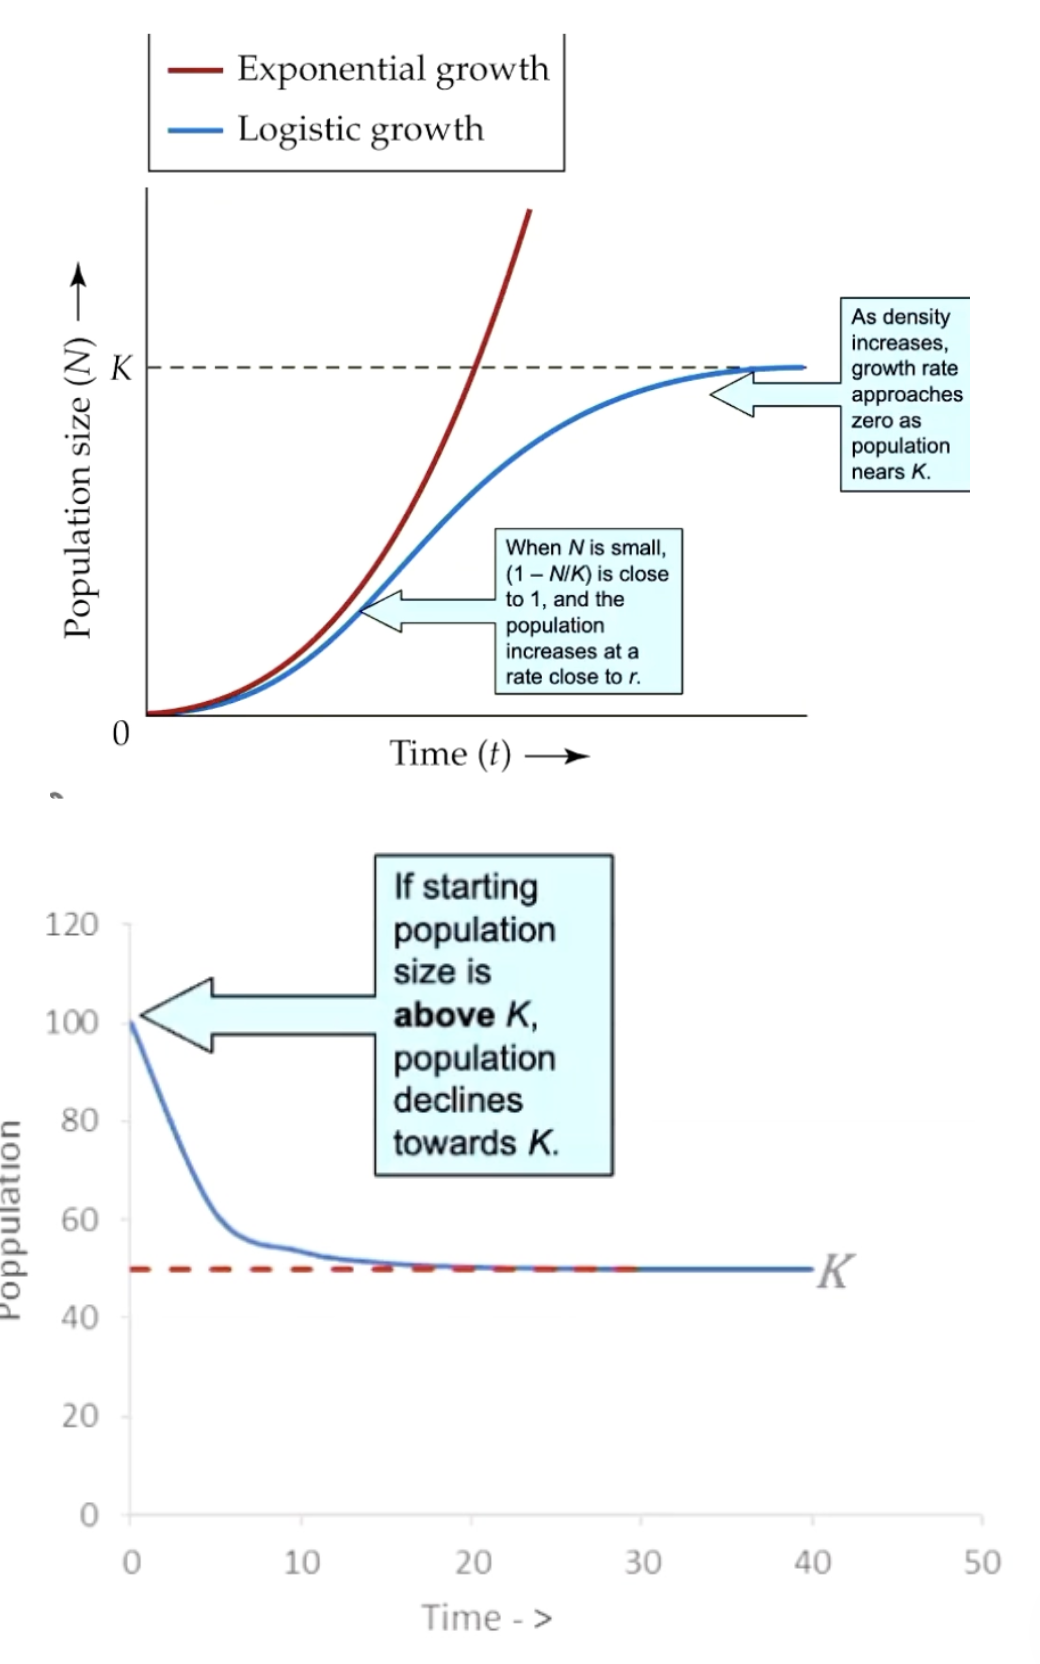
the logistic equation incorporates limits to growth and shows how a population may stabilise at maximum size, the carrying capacity

the logistic equation*

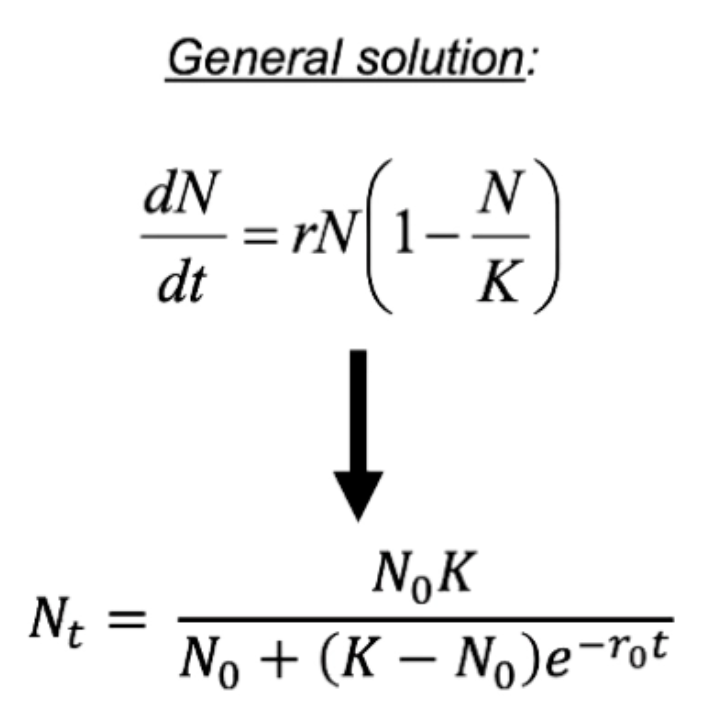
general solution*
plots of real population growth rarely match the logistic curve exactly
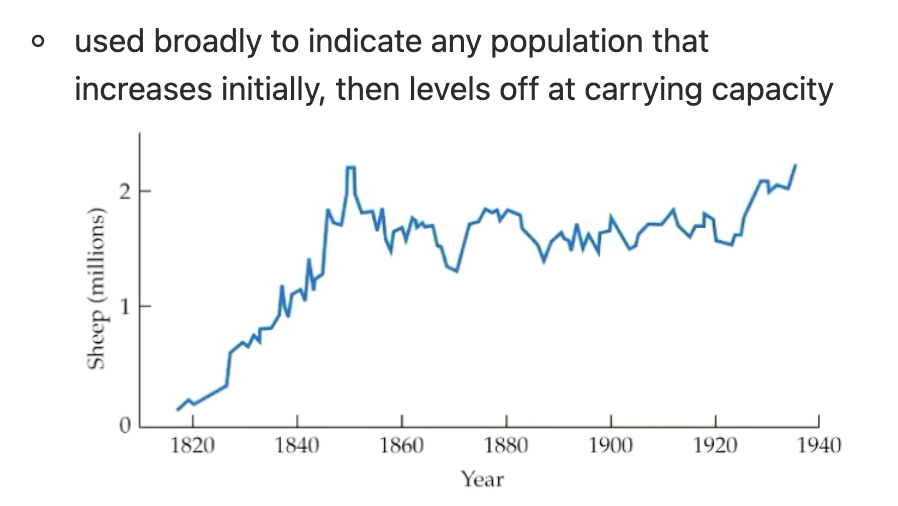
why does population growth rarely match the logistic curve exactly?

dynamic models

discrete time
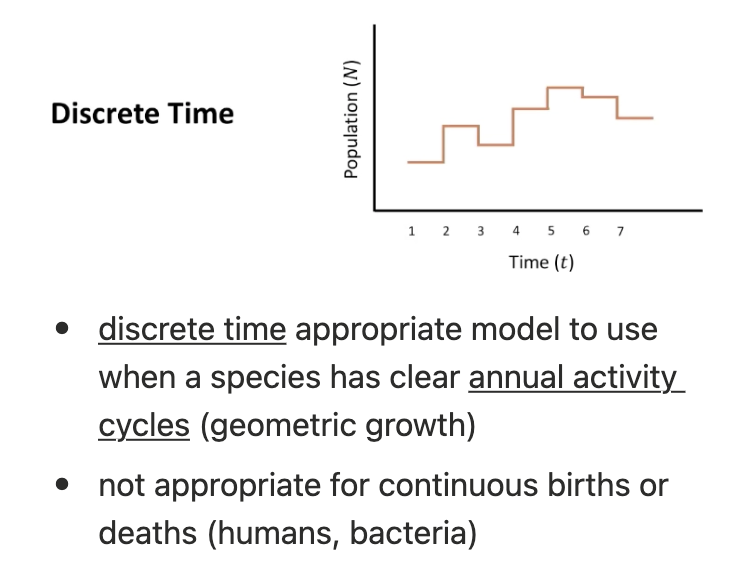
continuous time

in a closed system, the population change =
equation*

we can get birth and death rates since they are more constant than B and D*

general solution for population at time (t) with continuous population growth:

the exponential equation!
Population (N) change in exponential → constant doubling

equilibrium for N*

for change in N to be 0, N must be 0 for continuous growth model
populations that experience exponential growth are

density-dependence
often caused by biotic factors
predation
intraspecific competition for resources
disease or parasites
logistic population model (new parameter, K)*

logistic equilibrium*

quadratic! therefore 2 values of equilibrium

graphing*

equilibrium stability*

harvesting (e.g. fishing)

assumptions of logistic models 3

environmental variability
chance
population structure
the significance of density-dependence has been controversial and disputed (relative to density-independence)
summary (?)

regulation !
how a population remains within defined upper and lower limits
abundance
absolute size of a population are determined by a number of processes
both dependent and independent factors
arguments against regulation
argument that there is no ultimate proof of regulation in nature, and nature is too heterogeneous for this to occur
apple thrips case study
argument that organisms are constantly in a state of setback and recovery due to environmental factors
78% of variation in abundance could be determined by winter temp and spring rainfall
using this data, abundance of thrips in the following year could be estimated
dune plant case study
unrestrained growth cannot occur infinitely
density-dependent effect on reproduction of plant
but physical conditions of the site determined mortality and thus the abundance observed, which was independent of density
effects of scale
much of the work on population limits has been done on insects and pests which may have more variable populations than longer lived taxa
stochastic processes shape population dynamics
define stochastic processes

environmental stochasticity
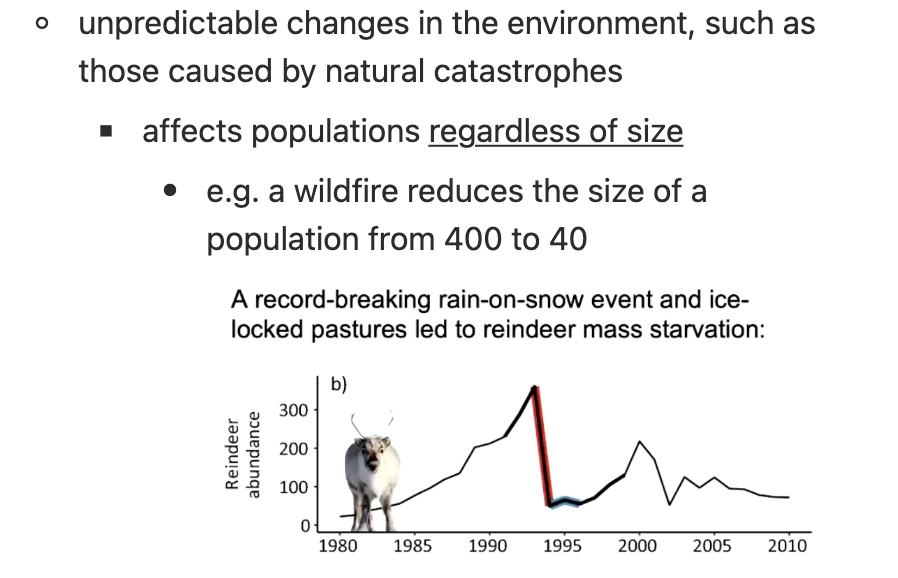
demographic stochasticity

stochastic births and deaths
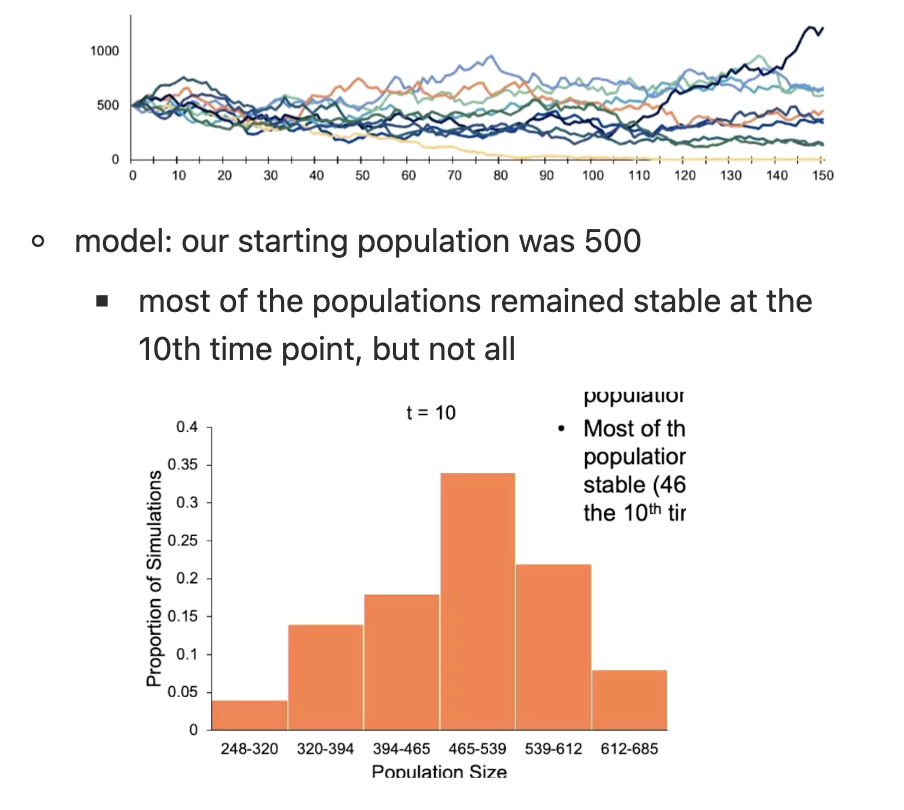
the risk of extinction increases greatly in small populations

given time, all populations that experience stochasticity (both environmental and demographic) will eventually go extinct)

dunnart population projections in two parts
leslie-matrix projection of a population
without density feedback, with density feedback, and with stochasticity

the life history strategy of a species
seasonal life history strategies


long-term data show many species are initiating spring activities earlier in response to climate change
but shifts in timing don’t always keep pace with climate change
life history patterns can be classified along several dimensions

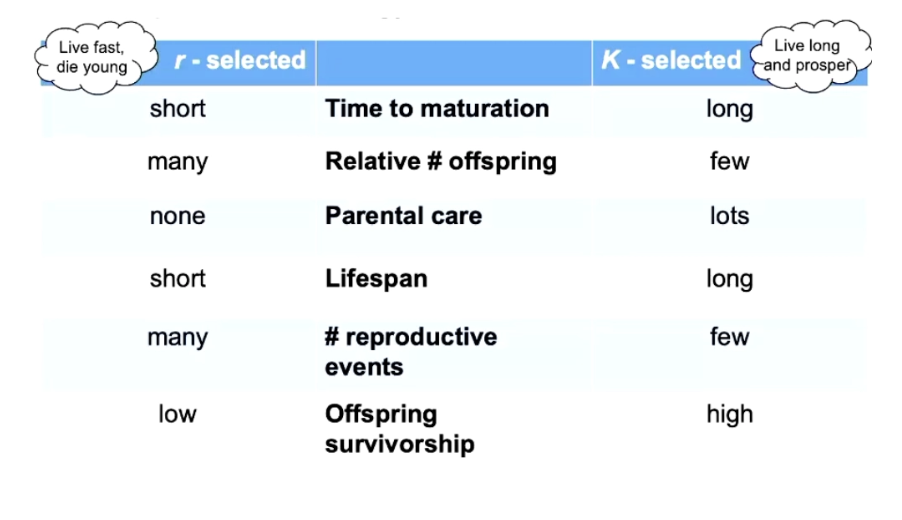
r-selection and k-selection describe two ends of a reproductive strategy continuum
time to mature
number of offspring
parental care
lifespan
number of reproductive events
offspring survivorship
tradeoffs between life history traits
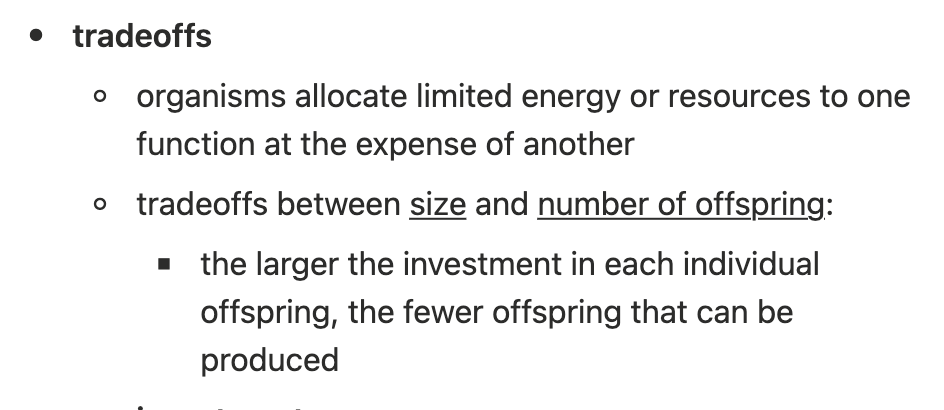
investments


is the below graph reflecting r or K selection?

obv K selection because fewer offspring with higher survival
life tables can summarise a diverse array of life histories by focusing on the way that survivorship and fecundity change with age*


life cycle occurs in a year
can fit several generations in a year or just one
annual life histories