Distributions
 Call Kai
 Learn
 Practice Test
 Spaced Repetition
 Match
 Flashcards
 Knowt Play
1/4

There's no tags or description
Looks like no tags are added yet.
5 Terms
Explain what a frequency distribution is
Frequencies relating to continuous data can be plotted as bars on a histogram or as a
continuous curved line on a frequency distribution.
Explain Normal Distribution
Appears as a bell-shape curve with the
following features:
• The mean, median and mode are at the midpoint of the
graph.
• The graph is symmetrical around the midpoint.
• The dispersion of data either side of the midpoint is
consistent.
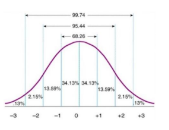
For any normal distribution, 68.26% of the data will lie within
one standard deviation from the mean. 95.44% of the data lie
within two standard deviations from the mean. 99.74% of the
data are three standard deviations from the mean.
Explain what a skewed distribution is
If the data are not an even distribution either side of the mean, the
distribution will be skewed.
Explain Positively Skewed Distribution
A Positively Skewed Distribution: has most data falling below the
mean, which means the data is concentrated on the left of the
graph, with a long tail of scores to the right. It therefore contains
more low scores than high. When mode<median<mean the data
has a positive skew.

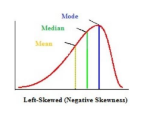
Explain Negatively Skewed Distribution
A Negatively Skewed Distribution: has most data falling above the
mean, the bulk of the scores are concentrated on the right of the
graph, with a long tail of scores on the left. It therefore contains
more high scores than low. When mean<median<mode the data
has a negative skew