MATH 1200 Exam 3 study guide
 Call Kai
 Learn
 Practice Test
 Spaced Repetition
 Match
 Flashcards
 Knowt Play
1/48

There's no tags or description
Looks like no tags are added yet.
49 Terms
Sampling distribution
The _________ of a statistic is a probability distribution for all possible values of the statistic computed from a sample of size
Sampling distribution of the sample mean
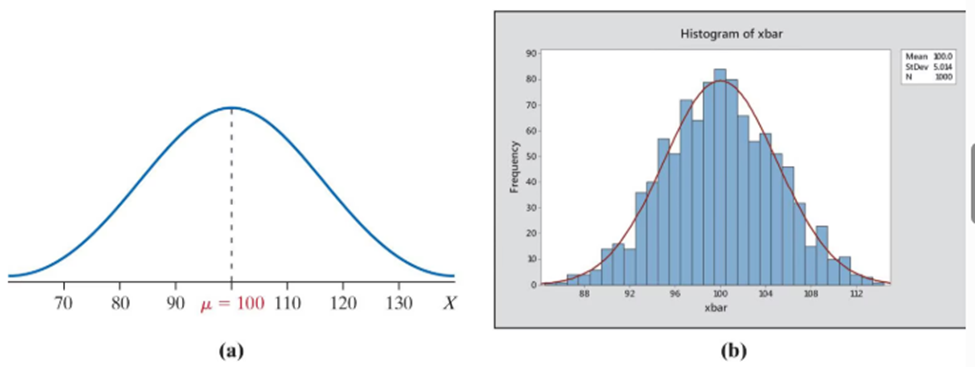
The __________ x̄ is the probability distribution of all possible values of the random variable x̄ computed from a sample of size n from a population with mean μ and standard deviation σ.
Standard error of the mean
Suppose that a simple random sample of size n is drawn from a population with mean μ and standard deviation σ. The sampling distribution of x has mean μxˉ=μ and standard deviation σxˉ=nσ . The standard deviation of the sampling distribution of x̄, σxˉ is called the __________.
The Central Limit Theorem
Regardless of the shape of the underlying population, the sampling distribution of x̄ becomes approximately normal as the sample size, n, increases.
Sample proportion
The proportion of individuals in a sample who have a specified characteristic. · Suppose that a random sample of size n is obtained from a population in which each individual either does or does not have a certain characteristic. The _________, denoted p̂(read “p-hat”), is given by

Point estimate
A(n) _________ is the value of a statistic that estimates the value of a parameter.
±
· The symbol ____ is read “plus or minus.” It means “to add and subtract the quantity following the ___ symbol.”
Confidence interval
A(n) _________ for an unknown parameter consists of an interval of numbers based on a point estimate.
Level of confidence
The _________ represents the expected proportion of intervals that will contain the parameter if a large number of different samples is obtained. The __________ is denoted (1-a) * 100%.

Compound inequalities
Inequalities of the form a < x < b are called ___________. These inequalities say that some number x is between a and b, For example, 3 < x < 8 says that x is between 3 and 8.
critical value
The value z2a is called the _________ of the distribution. It represents the number of standard deviations the sample statistic can be from the parameter and still result in an interval that includes the parameter.
True
(True/False) A 90% level of confidence does not tell us there is a 90% probability the parameter lies between the lower and upper bound.
False
(True/False) A 90% level of confidence does tell us there is a 90% probability the parameter lies between the lower and upper bound.
Constructing a (1 - a) * 100% Confidence Interval for a Population Proportion
What is this picture showing?

Margin of error
What is this equation for?

Sample Size Needed for Estimating the Population Proportion p
What is this picture showing?

Student’s t-Distribution
What is this picture showing?
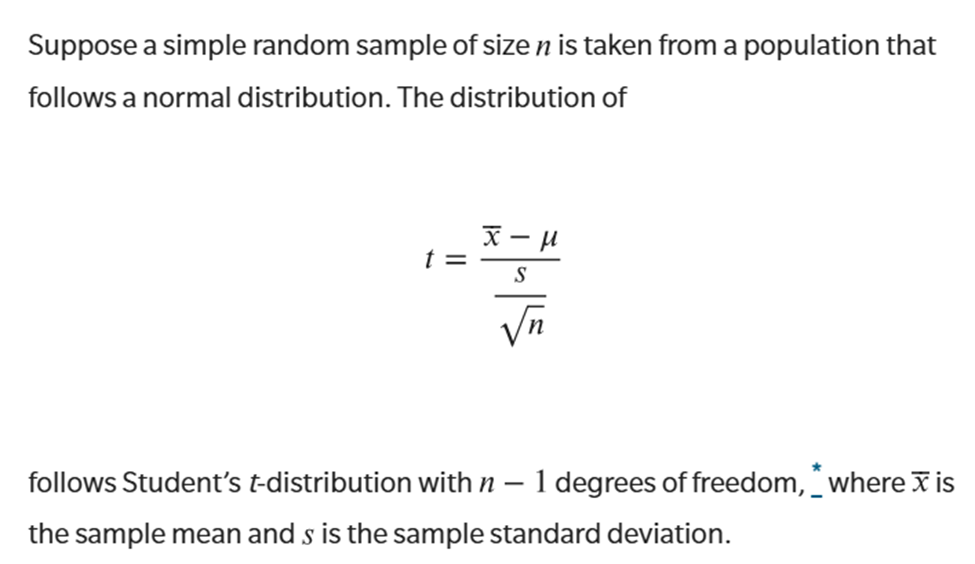
t-distribution
Properties of the ______
o The _________ is different for different degrees of freedom.
o The _________ is centered at and is symmetric about
o The area under the curve is 1. The area under the curve to the right of 0 equals the area under the curve to the left of 0, which equals 21 .
o As t increases or decreases without bound, the graph approaches, but never equals, zero.
o The area in the tails of the ________ is a little greater than the area in the tails of the standard normal distribution, because we are using s as an estimate of σ, thereby introducing further variability into the t-statistic.
o As the sample size n increases, the density curve of t gets closer to the standard normal density curve. This result occurs because, as the sample size increases, the values of get closer to the value of σ, by the Law of Large Numbers.
Constructing a (1 - a) * 100% Confidence Interval for μ
What is this picture showing?

t-interval
Because this confidence interval uses the t-distribution, it is often referred to as a(n) ___________.
Robust
An inferential method is ________ if it is accurate despite minor departures from its underlying assumptions (such as the assumption of normality in Student’s t-distribution).
Nonparametric procedures
We could increase the sample size beyond observations, or we could try to use __________. ___________ typically do not require normality, and the methods are resistant to outliers.
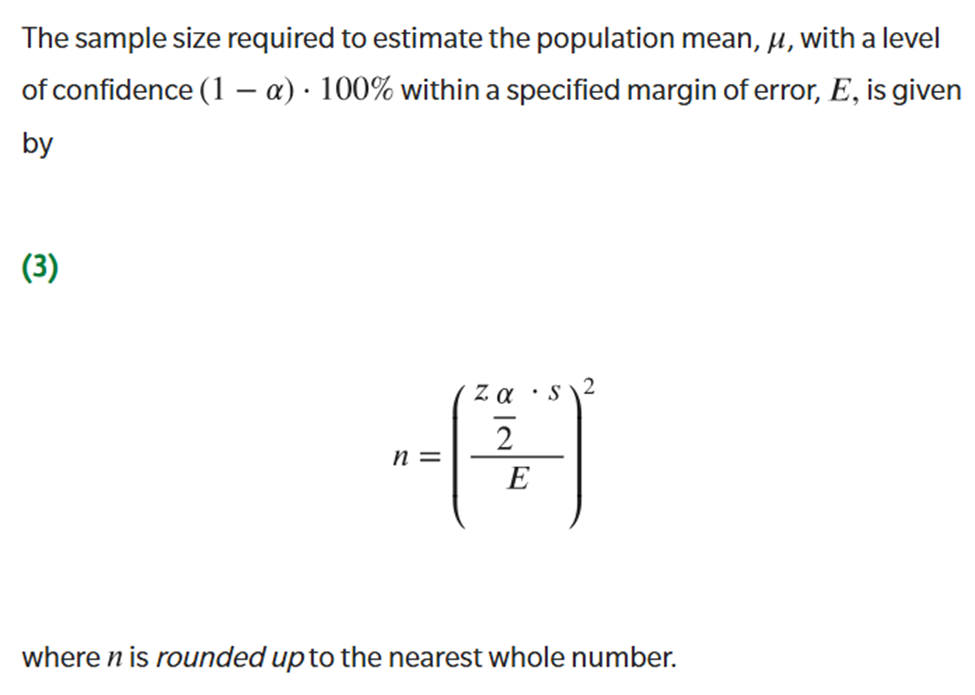
Determining the Sample Size n
What is this picture showing?
Construct a confidence interval for p
What method should I use
Which parameter are we estimating? - Proportion p
Construct a t-interval
What method should I use
Which parameter are we estimating? - Mean μ
is n≥30 ? - Yes
Construct a t-interval
What method should I use
Which parameter are we estimating? - Mean μ
is n≥30 ? - No
Do the data come from a population that is approximately normal with no outliers? - Yes
Use nonparametric methods or bootstrap
What method should I use
Which parameter are we estimating? - Mean μ
is n≥30 ? - No
Do the data come from a population that is approximately normal with no outliers? - No
Hypothesis
According to dictionary.com, a(n) __________ is a proposition assumed as a premise in an argument. The word ___________ comes from the Greek word hypotithenai, which means “to suppose.” The definition of __________ in statistics is given next. A(n) ________ is a statement regarding a characteristic of one or more populations.
Hypothesis testing
____________ is a procedure, based on sample evidence and probability, used to test statements regarding a characteristic of one or more populations.
1. Make a statement regarding the nature of the population.
2. Collect evidence (sample data) to test the statement.
3. Analyze the data to assess the plausibility of the statement.
Null hypothesis
The _________, denoted H0 (read “H-naught”), is a statement to be tested. The __________ is a statement of no change, no effect, or no difference and is assumed true until evidence indicates otherwise.
Alternative hypothesis
The __________, denoted H1 (read “H-one”), is a statement that we are trying to find evidence to support.
two-tailed test
What test is this?
H0 : parameter = some value
H1 : parameter ≠ some value
left-tailed test
What test is this?
H0 : parameter = some value
H1 : parameter < some value
right-tailed test
What test is this?
H0 : parameter = some value
H1 : parameter > some value
one-tailed tests
Left- and right-tailed tests are referred to as ________. Notice that in the left-tailed test the direction of the inequality sign in the alternative hypothesis points to the left (<), while in the right-tailed test the direction of the inequality sign in the alternative hypothesis points to the right (>). In all three tests, the null hypothesis contains a statement of equality.
>
What symbol do you use to represent “more than“
<
What symbol do you use to represent “less than“
≠
What symbol do you use to represent “different from“
Type I error
Reject the null hypothesis when the null hypothesis is true. This decision would be incorrect. This type of error is called a(n) __________.
Type II error
Do not reject the null hypothesis when the alternative hypothesis is true. This decision would be incorrect. This type of error is called a(n) _________.
Level of significance
The _________, a, is the probability of making a Type I error.
Statistically significant
When observed results are unlikely under the assumption that the null hypothesis is true, we say the result is _________ and we reject the null hypothesis.
Hypothesis Testing Using the Classical Approach
If the sample statistic is too many standard deviations from the population parameter stated in the null hypothesis, we reject the statement in the null hypothesis.
P-value
A(n) ________ is the probability of observing a sample statistic as extreme or more extreme than one observed under the assumption that the statement in the null hypothesis is true. Put another way, the _________ is the likelihood or probability that a sample will result in a statistic such as the one obtained if the statement in the null hypothesis is true.
Hypothesis Testing Using the P-value Approach
If the probability of getting a sample statistic as extreme or more extreme than the one obtained is small under the assumption the statement in the null hypothesis is true, reject the statement in the null hypothesis.
True
(True/False) The lower the P-value, the stronger the evidence against the statement in the null hypothesis.
False
(True/False) The higher the P-value, the stronger the evidence against the statement in the null hypothesis.
Practical significance
____________ refers to the idea that, while small differences between the statistic and parameter stated in the null hypothesis are statistically significant, the difference may not be large enough to cause concern or be considered important.