2 key skills 1030
 Call Kai
 Learn
 Practice Test
 Spaced Repetition
 Match
 Flashcards
 Knowt Play
1/89

There's no tags or description
Looks like no tags are added yet.
90 Terms
phrenology
pseudoscience
bumps on a persons scull could reveal personality or character traits
diff brain areas related to specific functions, could be found through the shape of peoples scull
bullshit
Are measures always objective
culture, perspective,
Operationalization
turning abstract theoretical concepts into concrete, measurable observations/variables
Strictly defining variables into measurable factors
how do we operationalize
Be precise about what you are trying to measure
determine how you will measure it
define allowable values
Nominal variable
variable with no natural order or rank
change in rank does not alter the meaning of the variable or give it more sense (i guess)
eg. eye colour, names, pets, types of transportation.
ordinal variable
catagories can be ranked in a logical order
example: climate attitude ‘strongly agree, agree, neutral, disagree, strongly, disagree’
discrete numeric variable
values are numbers
whole number, fixed value, can be positive negative or zero, but there are no decimals or fractions
specific separate and countable variables
distinct gaps between numbers
eg: numbers on dice
continuous numeric variable
‘measurement’ that can take any value within some range
includes decimals and fractions
eg: weight, height,

validity
do the results represent what they are supposed to represent
types of validity
internal, external, construct
internal validity, what is it and what threatens it?
the degree to which the effects observed in an experiment are due to the independent variable and not the confounds.
threats to internal validity
changes in conditions (study is distrupted)
control differs from experimental group (not randomly assigned which creates confounds)
Attrition bias (people leave the study because they are different in some way from the people who stay)
external validity
degree to which the findings/results apply outside the study and can be generalized to other people, settings, or situations
external validity threats 2 and solutions
sampling bias: the subject in the study are not representative of the group you want to generalize (results now cannot be generalized)
Hawthorne effect: change in behaviour as a consequence of being observed (you might act differently if you know youre in a study
fix: try to get a representative sample of the whole world, would have to be specific about where sample is from, may have to widen size.
could trick people about what the study is about so they dont change their behaviour.
balancing internal and external validity
field experiemtns
Lab experiments
pretesting in controlled settings and replication in real world settings
statistical controls
using a representative sample
construct validity
extent to which variables measure what they are supposed to measure
types of construct validity Face validity
face validity:
at first glace, it makes sense but the more you think about it, the less it makes sense
ex. taking measures of smiling as an indication of enjoyment (what about nervous smiling)
types of construct validity content validity
is my measure measuring everything i want it to measure?
ex. am i measuring enjoyment at the party via dancing to loud music and good conversations in quieter settings
types of construct validity criterion validity
does my measure predict or correlate with my expected outcome
ex. if people scored high on enjoyment they would also say they would like to party again
types of construct validity, Discriminant validity
is my measure correlated with something i’m not interested in
reliability
the degree to which a measure is stable and consistent over time
three kinds of reliability
over time
across items
across researchers
reliability: Over time
Repeated tests should give similar scores over time
reliability: Across items
observations and survey answers should be intercorrelated
(should be highly correlated across tests)
items are the tests, should be
across researchers
observers who observe the same people should arrive at similar scores
hierarchical filing system
Folders hold other folders and files
file paths - address that shows the exact location of the file or folder, step by step road path
make a logical folder structure
“Documents” or cloud, not desktop
download are found in the ”downloads” folder
cut, copy, paste files
what to remember when saving your files
use descriptive names - version numbers, dates, or combination of both
search for files in search window
copy cut and paste files (ways to move them around?)
citation styles, which one for psych, what are they
APA American Psychological Association
standardized writing and formatting systems used across disciplines
dictates the information necessary for a citation and how the information necessary in the citation (and formatting of the document) is ordered
doi
digital object identifier ( ID used for scientific papers)
why citation styles
each style serves a purpose for its field
each style is designed to serve the needs of its field
Each field of study uses a specific citation style to keep things consistent
consistency makes it easier for people in that field to read understand and compare scientific papers
ways to backup documents
icloud
dropbox
email copies to yourself
google drive
spreadsheets uses
enter data and metadata
organize data (changing format and moving around)
summarize
transform
simple visualization
Limits of spreadsheets
Excel:
There are better options for
big data sets
advanced visualization
advanced analysis
keys to tidy data
what is placed in columns vs rows
every column is a variable
every row is an observation
every cell is a single value
you don’t have multiple values in cells
she showed us how to expand cells and lock the title in Excel
how do you add a note (metadata) to excel
right click on cell and find ‘new note’
will show up as red tab in the corner until you click on the cell
how to sort data
select all data
data (top menu) and sort
how to summarize data
highlight headings
copy
highlight where you want to put new headings
paste (can change the colour)
under heading type =average( and then you can select the cells you want to calculate ie d2:d13)
why visualize your data
clearly indicates how values relate to one another
makes it easy to compare values
makes it easy to rank and order the values
makes it obvious how people should use this information
Humans and patterns - pro and con
Humans are very visual
visualizing data is useful for humans because were very good at finding patterns and making connections
we sometimes over interpret patterns, see connections even when they aren’t there
kinds of graphs
Column graphs
Bar graphs
box plot
histograph

column graph
works when:
x axis is catagorical
y is continuous, usually represents counts or averages
Error Bars: graphical lines added to some types of graphs that represent the variability of the data
Bar graphs
same as column graphs
x and y axes
x is catagorical
y is continuous
only used if catagorical data is long

Box plot
x is categorical
y is continuous
best for nonparametric data: data that does not follow a specific, normal, distribution; typically data are ranked, ordinal, or nominal, and analyzed using methods that focus on median values rather than means
center: the median (half the data is lower, half the data is higher) (usually)
not the average
box: inter-quartile range
whiskers: range excluding outliers
dots: outliers

Histogram
special kind of column
X is continuous or scalar variable that has been '“binned”
Y is count, frequency, or %
Shows distribution of the data

types of distributions:
symmetrical
also called normal or gaussian (nice bell curve)

types of distributions:
asymmetrical positive skew
positive skew
right skewed
right side is the ski slope (has less data)
negative skew
left skewed


Bimodal
two peaks or ‘modes’
two classes of data in the same graph

Uniform
flat/equal for all catagories
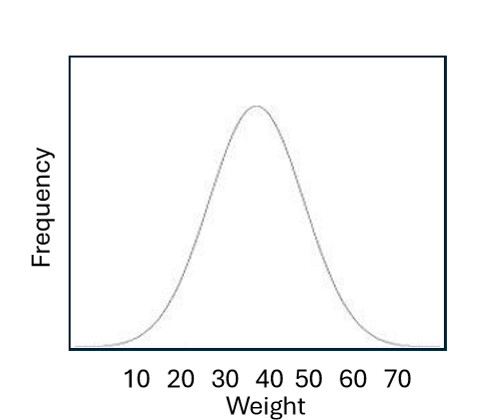
Density plot
a smoothed histogram
you cant see the individual bins
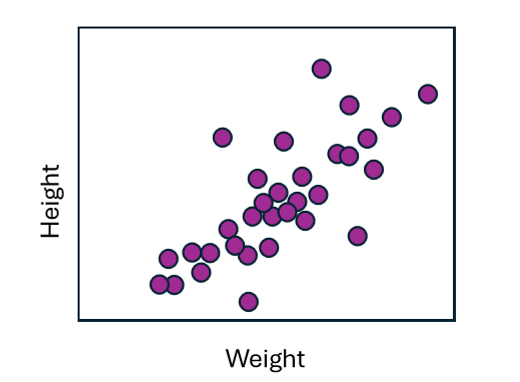
scatter plot
numeric X and Y
each point is one sampling unit
points can be coded with colour, size, and shape to add information
show nature of relationship

positive or negative?
Positive

Negative

Neutral

Line graph
x is time
y is numeric
the line must connect things that are inherently connected
how do we read graphs?
you cant just skim
based on a grammar and a vocabulary
symbols, visual encodings (length, positions, area, colour, text)
well designed charts arent only informative
some charts with demand work from you, always pay attention

what are the axes
what do the bars and colours represent
what pattern is present (direction, strength)
what might it mean?
the x axis is flavour, y axis is gender
bars are coloured for each gender
I wanna say the men are showing a negative skew (positive/right leaning im so confused)
and the women have a positive skew (negative/left leaning)
idk about strength
men seem to prefer vanilla and women chocolate

distribution is asymmetrical
actresses around 35-40 are most likely to win best actress

axes represent butter fat contents and density
I dont know whats goin onnnn

positively skewed
city cars get less mileage per gallon


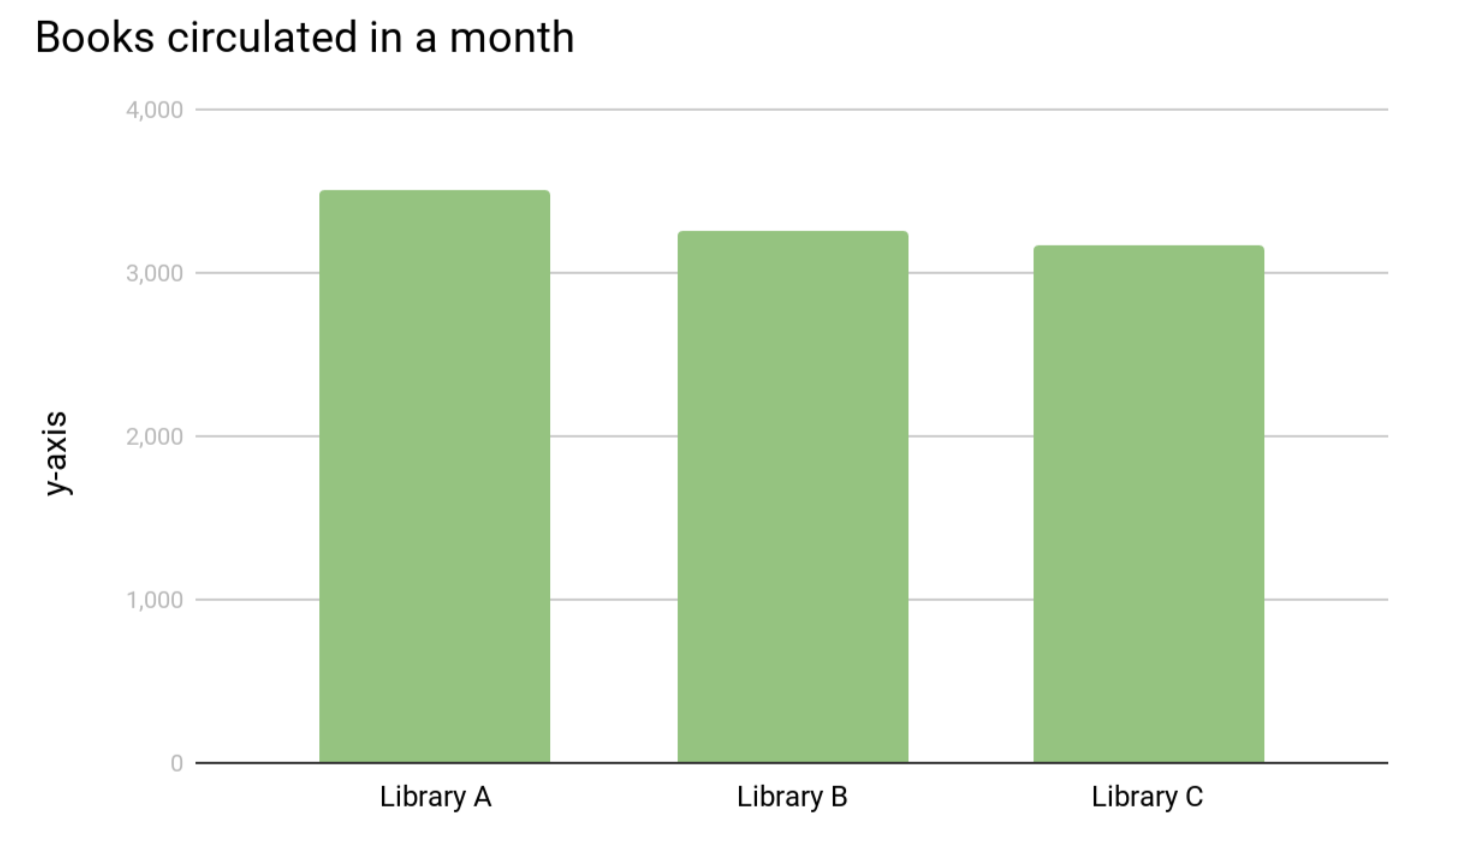
what is misleading about that
incomplete y-axis
what makes good graphs
Show data clearly: label axis, units of measure, consistent scale
Keep it simple: Remove 3D effects, heavy gridlines, extra art
Start at zero: Begin bar chart axes at zero so you do not make small differences look huge
Match chart to data: Pick the right visual shape so the reader understands the message fast
first step making graphs: Data
What kinds of data do I have?
What data should I use? only necessary data
second step: making a graph
what kind of plot do I need?
which one represents or connects the data in the most clear and accurate way
Highlight the data for 2010 and make scatterplot
highlight graph
chart design — select data
add new data
Add 2010 data
Name 2020 Data (I have no idea what’s going on)
step 3: Labels
Name axes
Label axes
Label scale
Additional labels?
w data(sample size, classes, legend?
how to make labels
I think theres a space you can click edit axes after making a graph
Writing is a super power (writing is thinking)
the act of forcing vague thoughts into structured sentences and paragraphs exposes incomplete logic and clarifies complex strategies
Four phases of writing
research
plan
write
REVISE
unethical uses of LLM’s
write full sentences, paragraphs, or essays
claiming authorship of LLM generated ideas
Use of LLM summaries and citations without verification
Annotated bibliography
prepare list of citations from google scholar
powerful prewriting tool for anything that requires research
write out important information about your sources so you can keep track of them
what are word counts for
a word count indicates the level of detail needed
shorter papers are difficult because they have to be concise
use word count to your advantage
create structure for each section
organize chunks beforehand (divide word count)
plan (thesis question)
can you reduce an assignment to a single question
every paragraph works towards answering that question
what should you do if you get stuck when trying to write
write anything even if its bad.
Classic Style “the sense of style” (who wrote a book on it) what were his philosophies
Linguistic and writing guide by a psych scientist Steven Pinker
Pinker applies modern language science and linguistic data to create clear coherent and beautiful styles
Prose acts as a clear window into objective reality.
The writer presents information as if initiating a conversation between equals, rather than lecturing or hiding behind formal pomposity.
Primary cause of opaque, convoluted writing
The curse of knowledge leads to overcomplicated, inaccessible writing
what to remember when writing (who for)
consider your reader
make it easy to read and comprehend
ideas should go forwards not backwards ( it is clearer and simpler, makes less cognitive demand of the reader)
provide reader with flow state
the curse of knowledge
the reader is intelligent, but they do not know what you know
you may have to provide extra background knowledge for your reader to understand your point
What are weak verbs
“be” verbs are weak
be, is, am, are, been, was, were
what is a key to strong writing (voice)
active voice
write sentences with subjects at the beginning
what helps the structure and content of a paragraph 2
strongly crafted topic sentences
Vary sentence length (creates rhythm not monotony)
storytelling four thingys
Heros journey
Narrative threads
Visual language
First draft is for?
You
shows the importance of Revising
rewriting and reworking (where real writing begins) so the second draft can be for your reader
three step editing process
Substantive Edit
Copy Edit
Proof reading
Substantive edit
structure - cut everything you don’t need
write transitions
reverse outline
Copy edit
ensure a consistent style and voice is maintained throughout
find and fix issues w/ clarity and accuracy
check facts
Improve flow and readability
Highlight flaws in logic
The writers diet website
Proof reading
grammar, punctuation, captials, spelling.
using right words
check references, formatting, and general style against style guise requirements
Reverse outline, what does it do, how does it help,
(see the literal structure, # of paragraphs, one sentence summary, list the summaries in order)
see the use and length of your paragraphs, are you showing biases towards a topic over another, do your ideas connect
this allows you to restructure the essay