Econo test 1
 Call Kai
 Learn
 Practice Test
 Spaced Repetition
 Match
 Flashcards
 Knowt Play
1/24

25 Terms

mean
the average of a set of numbers

Median (even sample size)

Median (odd sample size)

Mode
Most frequent occurring number
Finding percentile of a value

Quartile value

Interquartile Range (IQR)
IQR= Q3 - Q1
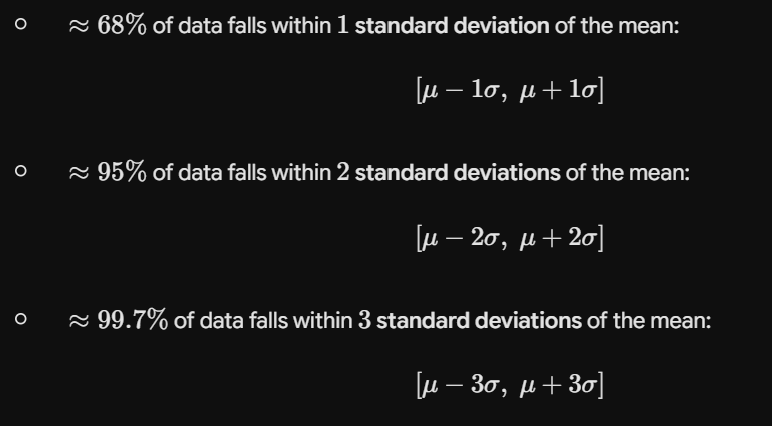
Empirical Rule (for bell-shaped, symmetric data)

Multiplication Rule (Joint Probability

Nominal
Pure labels, categories, or names. No inherent order, and numbers are just identifiers.
University degree name, hair color, school attended
ordinal
Categories with a meaningful rank or order, but the numerical distance between them is not defined.
Examples: Product ratings (1 = Poor, 2 = Average, 3 = Good), class standing (Frosh, Soph, Junior, Senior), survey satisfaction.
Discrete variable
Discrete values have gaps between them.
They are almost always whole numbers (0,1,2,3…). You cannot have fractions or infinite decimals in between.
The Test: Ask yourself, "Can this value be 2.37841?" If that makes no sense, it is discrete.
Examples from your exam & real life:
Number of customer complaints in a day (you can have 1 or 2 complaints, but never 1.47 complaints).
Number of cars sold by a dealership.
Number of students in a lecture hall.
Number of defective light bulbs in a box.
Continuous variable
Measurable values that can take on decimals/fractions over an interval.
Continuous values have no gaps. They can take on any value within a range or interval—including infinite decimals.
They depend on how precise your measuring tool (stopwatch, scale, ruler) is.
The Test: Between any two numbers (like 5 and 6), can you always find another number in between (like 5.5, 5.55, 5.555)? If yes, it is continuous.
Examples from your exam & real life:
Time: Time spent waiting in a drive-thru (e.g., 4.25 minutes, 4.258 minutes).
Money / Financial amounts: Monthly electricity bill ($142.36), stock return percentages ($3.14\%$).
Physical measurements: Height, weight, distance, temperature.
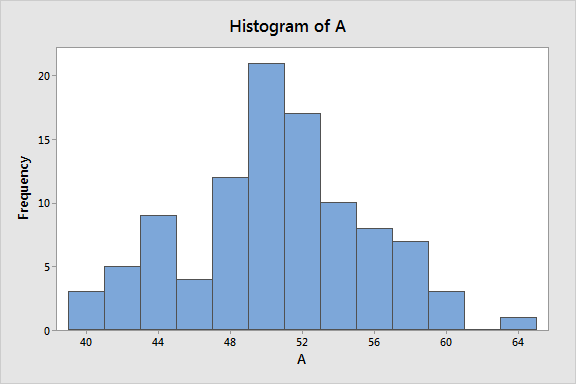
Histogram graph
Pareto Diagram

Chebyshev's Theorem

Z-scores

Covariance

Correlation Coefficient (r)

Expected value of a discrete random variable X

right skew
right is the tail and the bump is left side (mean>median> mode
Left skew
The tail is the left side the bump is the right (mean<median<mode
Empirical Rule
What does the sample correlation coefficient (r) measure, and how do you interpret its value?
