Epi Measures of Disease Occurence
 Call Kai
 Learn
 Practice Test
 Spaced Repetition
 Match
 Flashcards
 Knowt Play
1/45

There's no tags or description
Looks like no tags are added yet.
46 Terms
Ratio
Value obtained by dividing one quantity by another
Ratio = x/y
There does not have to be a relation between two values

Proportion
Type of ratio
Numerator is part of the denominator
Proportion = A / A + B
Percentage
A proportion that has been multiplied by 100
Percentage = (A / A + B) * 100

What’s the point?
tells u how important a health outcome is in relation to the size of a group
Proportion is 10%, shows a different picture than if the proportion is 80%
Very important in epidemiology to get an accurate denominator

Rate
Type of ratio, but it involves time
Rate = number of events/time
Measures:
Risks associated with exposure
Speed of a development of a disease
Can be used to make comparisons between populations
Epidemiological measures: Count
Number of cases of a disease or other health phenomenon being studied
Also called “frequency”

Epidemiological measures: Incidence
Number of instances of illness commencing, or of persons falling ill, during a given period in a specified population
More generally, the number of NEW health-related events in a defined population within a specified period of time
What do measures of incidence do?
Measure
Risk of acquiring a disease
Rate at which new cases of disease develop in a population
Other health outcomes
Important to the study of causal mechanisms or causes of diseases

Incidence Rate

Risk
# of new cases of disease (over a specific time period) / # of people at risk during the time period
Rate
# of new cases of disease (over a specific time period) / amount of person time at risk for disease
Cumulative Incidence (ris)
Incidence rate, but when all individuals in the population are at risk throughout the time period of observation
Example: participants in a cohort study and no new members are allowed to enter the study after it begins
The population is static

Incidence Density
Incidence rate, but when the time periods of observation of the members of a population vary from person to person
Example: a cohort study where participants observed for varying periods of time because some drop out before the study is completed
Person-time = total period of time that each individual at risk has been observed


Attack Rate
Incidence rate when the occurrence of disease among the population at risk increases greatly over a short period of time
Often related to a specific exposure
Describes foodborne illness, infectious disease, and other acute epidemics
Not a true rate because the time dimension is often uncertain

Prevalence (LOOK AT SLIDES FOR EXAMPLE)
Number of existing cases of a disease, health condition, or deaths in a population at some designated time
Used to measure the scope and distribution of health outcomes in the population (“burden of disease”)
Expressed as a proportion
Two types:
Point prevalence
Period prevalence
Point Prevalence
All cases of a disease, health condition or deaths that exist at a particular point in time relative to a specific population from which the cases are derived
Expressed as a proportion
Proportion x 100 is %

Period Prevalence
The total number of cases of a disease that exist during a specific period of time (week, month, year)

Factors influencing prevalence

Measures of Mortality
Life expectancy
Crude death rate
Crude fatality rate
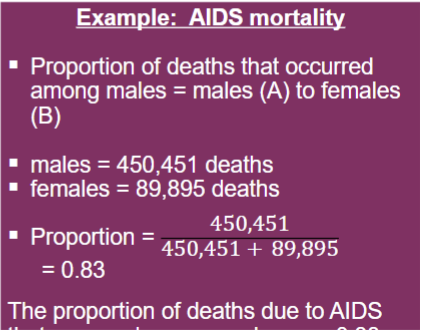
Proportional mortality rate
Life expectancy
The number of years that a person is expected to live, at any particular year
In 2013, the life expectancy for the US population was 78.8 years overall
81.2 years for females
76.4 years for males
Crude rate
type of rate that has not been modified to take into account any other factors that may affect the rate
examples: crude death rate

Specific rate
type of rate referring to a particular subgroup of the population
examples: cause-specific, age-specific
Adjusted rate
type of rate in which statistical procedures have been applied to permit fair comparisons across populations
examples: age-adjusted rate
Benefits of Rates
Improve our ability to make comparisons
Example: Compare deaths in Texas to deaths in Rhode Island in 2020…
Deaths in Texas: 249,267
Deaths in Rhode Island: 12,110
The size of the population is crucial to understanding the full picture!
Crude death rate

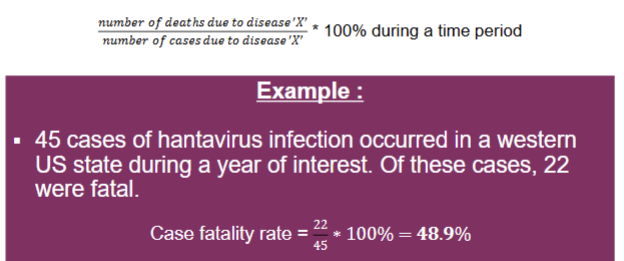
Case fatality rate (CFR)
Proportional mortality ratio (PMR)

Limitation of Rates
Reduces the standard of comparison to a common denominator
Example: Compare deaths due to heart disease between Texas and New York in 2013
Death rate in TX: 152 per 100,000
Death rate in NY: 224.1 per 100,000
There may be differences in the population (age) we need to consider…
Cause specific rate

Age-specific rate

Sex-specific rates

Adjusted rates
A rate of morbidity or mortality in a population in which statistical procedures have been applied to permit fair comparisons across populations by removing the effect of differences in the composition of various populations
Age-adjusted rates
use detailed information about age structure of population for which the rates are being age adjusted
Direct method rates
multiplying the age-specific rates for each subgroup of a population to be standardized by the number in a comparable subgroup of a standard population
Measures of natality: Maternal mortality rate
reflects health disparities such as healthcare access
Measures of natality: Fetal death rate/late fetal death rate
Measures risk of death of the fetus
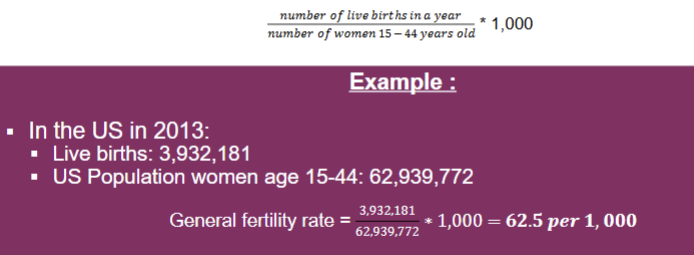
Measures of natality: General fertility rate
compares populations and subgroups regarding their fertility
Measures of natality: Crude birth rate
to project population changes
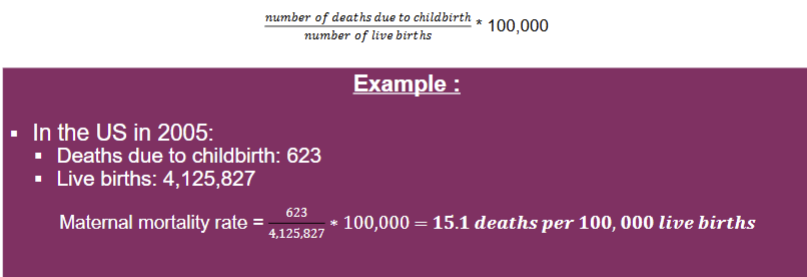
Maternal mortality rate
Infant mortality rate

Fetal mortality rate

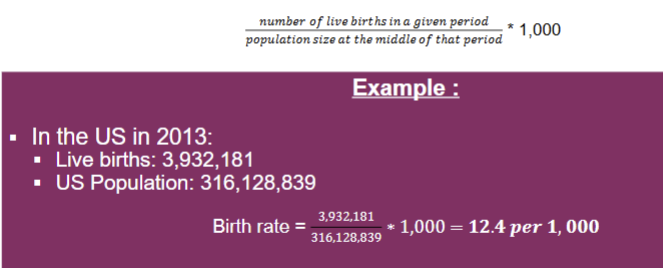
Crude birth rate
General fertility rate
Perinatal mortality rate

Incidence measures
new cases
Crude death rate (mortality rate)
