EBP Chapter 6: Descriptive Statistics
 Call Kai
 Learn
 Practice Test
 Spaced Repetition
 Match
 Flashcards
 Knowt Play
1/41

There's no tags or description
Looks like no tags are added yet.
42 Terms
define raw data
data collected from each measured variables
-must be aggregated and transformed in order to be meaningfully interpreted
techniques of raw data
-frequency distributions
-descriptive statistics
-measures of central tendency
-measures of dispersion
define frequency distributions
a table that indicates how many individuals (and the %) in the sample fall into each set of categories
-categorical (nominal) variables
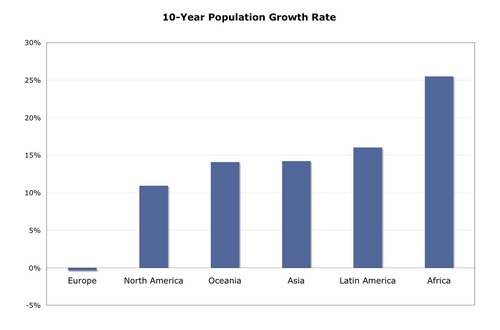
what is a bar chart used for?
a visual display of a frequency distribution
-bars not touching = nominal categories
define grouped frequency distributions
shows the frequency of a subset of scores by combining adjacent values into a set of categories
-approach to summarizing continuous variables

what is a histogram used for?
visual display of a grouped frequency distribution
-bars touching = continuous variables

define frequency curve
-basically a grouped frequency distribution indicated by lines instead of bars
-useful for displaying trend data
define descriptive statistics/ distribution variable
numbers that summarize the data pattern of scores observed on a measured variable
-this pattern is called the distribution variable
what are 3 measures of central tendency
-mean
-median
-mode
what are 3 measures of dispersion (spread)?
-range
-variance
-standard deviation
which is the most commonly used measure of central tendency?
mean
how many means can there be per distribution?
only ONE mean per distribution
another name for mean
average
what is the mean influenced by?
extreme scores (outliers)
define median
score in the center of the distribution
-only ONE value per distribution
-NOT influenced by outliers
-used with distributions that are not "normal" (skewed)
define mode
value that occurs most frequently in a distribution
-can have more than one more
-not influenced by outliers
-gives the least information in terms of description of the data
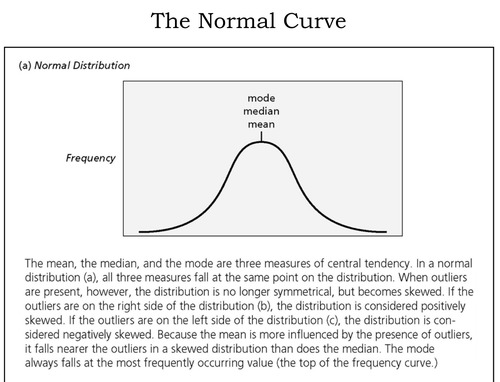
define distribution
the pattern of scores observed on a measured variable
what is a normal distribution?
data distributions that are shaped like a bell
where do measures of central tendency fall on a curve?
all three measures of central tendency fall at the same point on the distribution
-mode is always at the top
-median is always in the middle
-mean is always the tail
skewed distributions (outliers)
-extreme scores in a distribution
-results in distributions that are not symmetrical
-can either be positively or negatively skewed

positively skewed distribution

negatively skewed distribution
define dispersion
aka the "spread" of data
-the extent to which scored are tightly clustered around or spread out away from the measures of central tendency
what are the 3 values of dispersion?
-range
-variance
-standard deviation
define range
-simple measure of dispersion, and is least useful
-calculated as the maximum observed score minus the minimum observed score
what is the most common measure of dispersion reported?
standard deviation

define standard deviation
useful for describing how much the scores in a set of data vary
what does a large standard deviation indicate?
a large standard deviation in relation to the value of the mean indicated a large spread of scores in the data set
how is dispersion symbolized?
dispersion = s
what ways is dispersion calculated? (4)
-mean deviations
-sum of squares
-variance of s^2
-standard deviation or s
define mean deviations
computing each score minus the mean of the variable
define sum of squares
squaring the mean deviations and summing them
define / equation variance or s^2
dividing the sum of squares by the sample size, N
define (rlly caluate) standard deviation or s
taking the square root of the variance
characteristics of range
-simplest
-computation includes only the highest and lowest scores in the distribution of scores
characteristics of variance
-more sophisticated
-computation includes all scores in the distribution
characteristics of standard deviation
-square root of the variance
-has same characteristics of the variance
-commonly reported in oral health research reports
-is associated with the normal curve
standard deviation and the normal curve
standard deviation and the normal curve'
assuming a normal distribution, we can estimate the percentage of subjects who obtain certain scores just by knowing the mean and standard deviation of the data
the empirical rule
approx. 68% of the scores will fall in the range defined as +/- 1 standard deviation
-approx 95% of the scores will fall bw +/- 2 standard deviations from the mean
-approx 99% of the scores will fall between +/- 3 standard deviations from the mean
what is the ultimate purpose of descriptive stats?
make inferences about the population
define margin of error
because of random error, sample characteristics will most likely not be exactly the same as the population.
how to minimize margin of error (3):
-increase the size of a sample (N)
-this makes it more likely the sample will be representative of the population
-provides more precise estimates of population characteristics