CHE 220 - Midterm Exam
 Call Kai
 Learn
 Practice Test
 Spaced Repetition
 Match
 Flashcards
 Knowt Play
1/36

There's no tags or description
Looks like no tags are added yet.
37 Terms
Statistics
Making and interpreting measurements related to the “state”
Data
Qualitative or Quantitative (continuous or discrete)
Population
Everything you care about
Sample
Part of the population you measure
Parameter
Number describing population
Statistic
Number describing sample
Mean
Sum of all data divided by number of data

Median
Data sorted, middle point (or average of middle 2)
Mode
Most-frequent data point
Deviation
How far the value is from a reference point (usually mean)
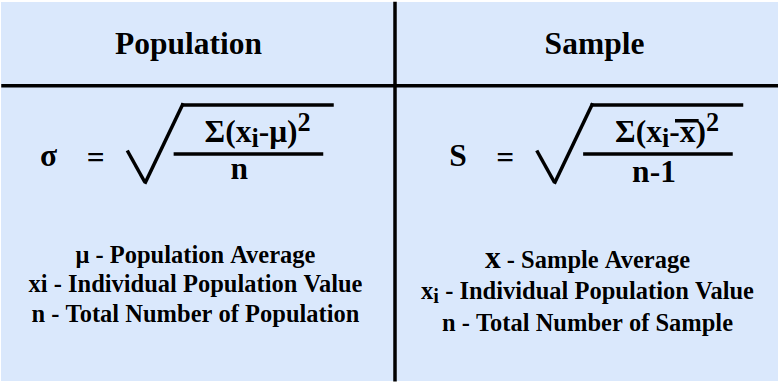
Variance
Average deviation from the mean squared

Standard Deviation
Average deviation of a point of data from the mean
Interquartile Range
Q3 - Q1
Outliers
Q1 - 1.5IQR < x < Q3 + 1.5IQR
Dot Diagram
Dots above corresponding value

Stem and Leaf Diagram

Frequency distribution
data grouped in to bins
Bin limits
endpoint of bin
Class marker
midpoint of bin
Endpoint convention
decided whether endpoint is in bin or not
left means lower endpt included
right means upper endpt included
Pareto Diagram
Bar graph with cumulative frequency line

Histogram
Bar graph, sometimes with CRF line, and x-axis number line

Box plot
Box with Q1 - 1.5IQR < x < Q3 + 1.5IQR , median line in box, and lines sticking out are endpoints (NOT OUTLIERS)

Sample Space
All possible outcomes of an experiment
Subset
Parts of a sample space
Event
Subset(s) of a sample space
Union
In either event (OR, E1 U E2)
Intersection
In both events (AND, E1 ∩ E2)
Complement
In one but not the other (NOT, E’)
Multiplication Rule
If an event has n1, n2, n3, … nk, the total number of outcomes is n1 x n2 x n3 x … nk
Permutation
items are ordered in a specific order (order matters AB not same as BA)
Combination
items are grouped together (order doesn't matter AB = BA)
Probability
Same as chance, number of successes over number of outcomes

Odds
Probability of something occurring over probability of it not occurring
Random variable
assigns value to each outcome (X) (not specific value, x)
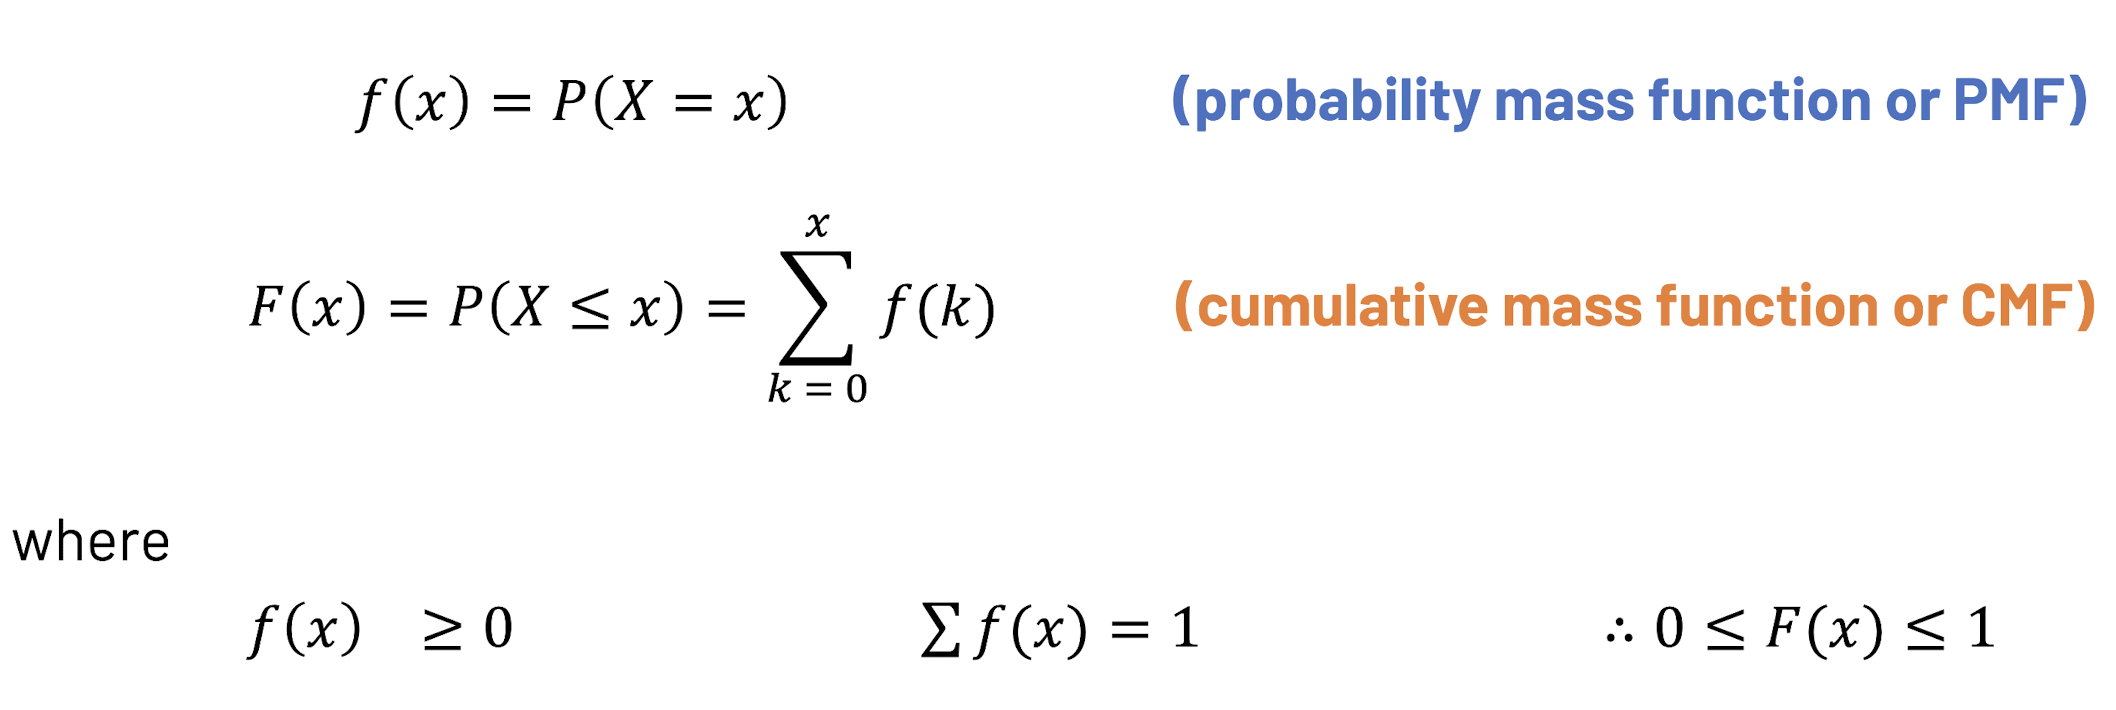
PMF & CMF
Bernouli Trials
each trial has 2 outcomes
each trial has the same probability
each trial is independent
fixed number of trials