Biology 202: Biostatistics
 Call Kai
 Learn
 Practice Test
 Spaced Repetition
 Match
 Flashcards
 Knowt Play
1/72

Earn XP
Description and Tags
Based on the midterm review powerpoint
73 Terms
Why do questionable practices (QRP) flourish:
The research ecosystem rewards quantity over quality, and flashy, “novel” results over careful, incremental progress
Researchers face constant pressure to publish many papers
Why are questionable practices bad?
If QRPs flourish too many studies cannot be replicated. Poorly documented methods, data and code make it hard even to reproduce one’s own past work
What is Reproducibility?
The minimum standard : others can get the same result from the same data and analysis
What is replication?
Using new data with the same methods. It is the ideal, and it builds strength of evidence
Draw the reproducibility table:

What is exploratory research?
Purpose: Hypothesis generation, using data to find patterns and generates hypothesis
Flexible, no rigid analysis path
Discovery of unexpected patterns and new lines of research
What is confirmatory research?
Purpose: Hypothesis testing, testing an a priori hypothesis and its predictions
Clear study design and analysis plan strictly followed. Diagnostic evidence for explanatory claims
What type of studies can exploratory and confirmatory research use?
Both can use observational and experimental studies
What is an example of Questionable Research Practise?
Presenting exploratory findings as if they were confirmatory
What is publication bias?
Positive results are more likely to be published than null or negative results
What is the file drawer problem?
Studies with null results often never leave the researcher’s file draw
What is the result of publication bias and the file drawer problem?
Biased literature
Published effects look larger and more consistent than they really are
What is low statistical power?
When real effects are easily missed and the significant results that do appear include more false positives and exaggerated effect sizes
What is P-hacking?
Data processing and analytical choices made after seeing and interacting with the data
Results become data dependent, so false-positive (Type 1) error rates rise
What is HARKing?
Hypothesising After the Results are Known
Exploratory findings are presented as though the hypothesis was defined in advance
False positive rates are higher
What is FAIR data?
Findable, accessible, interoperable, reusable
What are the benefits of open science and fair data?
Saves time and money, re-use of methods and code that work, avoids duplication while enabling replication, facilitates meta-analysis, faster discovery, more equitable access
What is a parameter?
A fixed constant, usually unknown
Relates to populations (all the individual units of interest)
What is an estimate?
- A random variable that changes from sample to sample (a subset of units that are measured)
Mean of population vs sample
μ and Ȳ respectively
Standard deviation of population vs sample
σ and s respectively
Size and proportion of population vs sample
N, p and n, p̂ respectively
What is sampling bias?
A systematic difference between an estimate and the parameter, it arises when the sample is not representative
What is sampling error?
A difference between an estimate and the parameter caused by chance; inevitable, expected, and measurable
Accurate vs precise
Accurate: estimates centred on the parameter (little bias)
Precise: estimates close to one another (little sampling error)
What do good random samples do?
Minimize bias and make it possible to measure the amount of sampling error
What is sample of convenience?
Individuals that happen to be available
Types of categorical variables:
Nominal: no nature order (genotype, province, survival)
Ordinal: natural order (e.g. pain severity)
Types of Numerical data:
Discrete: can be counted (e.g. number of offspring)
Continuous: can be measured (e.g. arm length)
What’s the difference between a frequency distribution and a probability distribution?
Frequency distributions counts the values in a sample, probability distributions are mathematical functions of the probabilities of outcomes
What is an experimental study?
A researcher assigns at least two treatments, at random
What is an observational study?
Treatments are not assigned, cause and effect cannot be assessed
What is a confounding variable?
An unmeasured variable that masks or distorts the casual relationship between measured variables
What graph do you choose for one categorical variable?
Frequency table or bar graph
What graph do you choose for one numerical variable?
Histogram
What graph do you choose for two categorical variables?
Grouped bar graph, mosaic plot
What graph do you choose for two numerical variables?
Scatterplot
What graph do you choose for one numerical and one categorical variable?
Box plot, violin plot or strip chart
What is the numerical centre?
Mean, median, mode
What is the numerical spread?
Variance, standard deviation, interquartile range, coefficient of variation
What is CV?
100 x s/ Ȳ
Unitless, compares variability across scales
When to use mean and standard deviation?
Frequency distribution roughly normal, no outliers
When to use median and IQR?
Non normal frequency distribution or with extreme values
What is sampling distribution?
The probability distribution of all values of an estimate we might get when sampling a population
It is not the same as the population distribution
Larger samples have narrower sampling distribution and more precise estimates
What is the standard error?
The standard deviation of the sampling distribution; the typical distance between an estimate and its parameter
What is the standard error of the mean?
s / √n
SE shrinks as n grows, but only with √n (4 times more data only halves the SE)
What value do you report estimates with?
The standard error – NEVER standard distribution
What is a confidence interval?
A range of values around the estimate the is likely to contain the parameter
What is the rule of thumb for confidence intervals?
95% CI for a mean
Ȳ − 2 SE to Ȳ + 2 SE
Larger samples give narrower intervals
“We are 95% confident that the population mean lies between ____ and____”
What is a random trial?
A process with two or more possible outcomes that cannot be predicted with certainty (e.g., randomly sampling a population)
What is probability?
The proportion of times it would occur if the trial were repeated over and over; always between 0 and 1
The probabilities of all possible sample proportions form the sampling distribution of the sample proportion
What is the sample space?
All possible outcomes
Probability rules table:
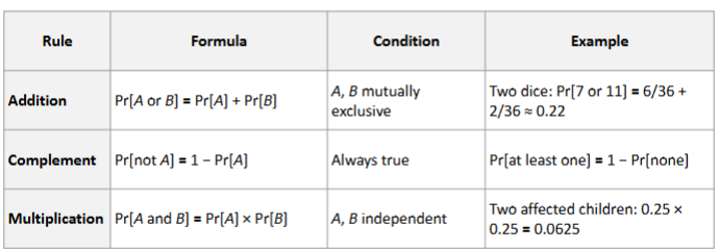
What does it mean by mutually exclusive?
Something that cannot happen together, so Pr[A and B] = 0
NEVER independent
Example: a toad cannot be both right- and left-handed
What does it mean by independent?
Knowing one occurred tells you nothing about the other
Example: toad 1 being right-handed says nothing about toad 2
How to check independence:
Compare Pr[A and B] with Pr[A] × Pr[B]
If they are equal, they are independent
How do probability trees work?
Multiple along a path (independent events)
Add across the mutually exclusive paths that make up the events
Why does independence matter?
If observations are not independent, those probabilities are wrong, and so are the P-values and confidence intervals built from them
What is H0 and HA?
H0: a specific statement about a population parameter
HA: all other feasible values
What is the test statistic?
A number calculated from the data to evaluate how compatible they are with H0
What is the null distribution?
The sampling distribution of the test statistic if H0 is true
What is the P-value?
The probability of obtaining the data (or data showing a greater difference from H0) if H0 were true
What is the significance level α?
Reject H0 if P ≤ α; set before the data are collected
Type I and Type II errors table

What is statistical power?
Power = 1 − β: the probability that a random sample leads to rejection of a false null hypothesis
Power increases with larger sample size, larger effect size (rarely known), and larger α
The convention is to aim for power = 0.8
Low power can make us conclude that nothing is going on when there is a real effect
What is the binomial distribution and what do the variables stand for?

Gives the probability of X successes in n trials when each trial has two possible outcomes
n = number of trials (fixed and independent)
p = probability of success (same in every trial)
pX(1 − p)n − X is the probability of any one path
What is the binomial test

H0: p = p0; HA: p ≠ p0
Test statistic: X, the observed number of successes; null distribution: binomial with n and p0
The P-value is exact: add the probabilities of outcomes as extreme or more extreme than X, and double it (two-sided)
Estimating a proportion variable information

p̂ estimates the population proportion p; the SE measures the precision of p̂
The SE gets smaller as n gets larger
Law of large numbers: as n increases, p̂ gets closer to the true p
Agresti-Coull confidence interval information:

Add 2 successes and 2 failures, then calculate; better than p̂ ± 1.96 SE, especially when n is small or p is near 0 or 1
What is the purpose of goodness-of-fit tests?
Compare an observed frequency distribution with the frequencies expected under a probability model
What is a proportional model
The frequency of events is proportional to the number of opportunities
e.g. fair die: 1/6 per face; births by day of the week; habitat use in proportion to area
χ² test statistic and df

Expected frequency of a category = n × its expected proportion (keep the decimals; they sum to n)
df = (number of categories) − 1 (when H0 fully specifies the model)
χ² = 0 is a perfect fit and grows as the fit gets worse; always use the right tail
Reject H0 if χ² exceeds the critical value for α (equivalently, P ≤ α)
What are the assumptions of the χ² test?
The observations are a random sample, and each is independent of the others
No category has an expected frequency less than 1
No more than 20% of the categories have an expected frequency less than 5