1.2. How Markets Work
 Call Kai
 Learn
 Practice Test
 Spaced Repetition
 Match
 Flashcards
 Knowt Play
1/65

There's no tags or description
Looks like no tags are added yet.
66 Terms
Define demand
quantity of goods and services that consumers are willing and able to purchase at a given time or price
What do consumers do?
buy + demand
What do producers do?
sell + supply
What does a demand curve look like?
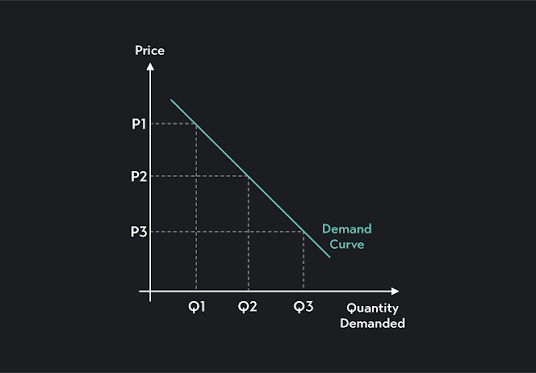
What two things can happen to a demand curve
movement
shift
Types of demand curve shifts
increase
→ shifts right/outwarddecrease
→ shifts left/inward

What type of factor causes a shift of the demand curve?
non-price factor
Factors that may cause a shift in the demand curve (conditions of demand)
income
consumer preferences
prices of related goods
tastes and preferences
population and demographics
expectations
Demand Curve Shift Factors: Income
as consumer income changes, the demand for goods and services shift
→ Normal goods: Demand increases with rising income (e.g. luxury cars)
→ Inferior goods: Demand increases with falling income (e.g. generic brands)
Demand Curve Shift Factors: Consumer preferences
changes in consumer preferences leads to shifts in demand
→ e.g. increased awareness of health = shift towards healthier food coices
Demand Curve Shift Factors: Prices of Related Goods
complementary goods: decrease in price of one good increases demand for its complementary good
→ e.g. decreased price of peanut butter = increased demand for jamsubstitute goods: increase in price of one good increases demand for substitute
→ e.g. increased price of Coke = increased demand for Pepsi
Demand Curve Shift Factors: Tastes and Preferences
trends can influence demand
Demand Curve Shift Factors: Population & Demographics
changes in population size or age demographics can affect demand
→ e.g. aging population = increased demand for healthcare
Demand Curve Shift Factors: Expectations
future expectations about prices, income or other factors can affect current demand
→ e.g. if consumer expects a future shortage of a product, they may increase current demand
Types of movement along demand curve
expansion
contraction

Causes of expansion of demand curve
decrease in price
= increase in quantity demanded

Cause of contraction of demand curve
increase in price
= decrease in quantity demanded
What causes the downwards sloping shape of a demand curve?
diminishing marginal utility
real income effect
substitution effect
Diminishing marginal utility (DMU)
DMU states that as a consumer consumes more units of a service, the additional satisfaction/utility derived from each additional unit decreases
This reflects the idea that people value the first unit the most and subsequent units less
How does DMU cause downwards sloping of a demand curve?
price must decrease for consumers to continue to buy more units of a product
→ e.g. if a consumer buys ice cream, the first scoop provides high utility but by the fifth scoop, the utility of each additional scoop decrease
→ therefore price must decrease for consumer to continue to buy more scoops
Real income effect
demand changes as a consumer’s real income (purchasing power)
real income changes as the price of goods changes
when the price of a good falls, the consumer’s real income increases because they can now afford more of the good
when the price of a good rises, real income decreases
Substitution effect
the effect of the change in demand of a good when its price changes, making it more or less expensive relative to other goods
consumers will choose substitutes if they are cheaper
Define supply
the quantity of goods and services that producers are willing and able to supply at a given time and price
Supply curve
Positive direct relationship

Movement along a supply curve
all else being equal, as the price of a good or service increases, quantity supplied also increases and vice versa

Shifts of a supply curve
when factors other than price cause a change in the quantity supplied at every price level

Factors that cause a shift in supply
Production costs
Technological advancements
Government policies & regulations
Natural Disasters & Weather Conditions
Changes in Expectations
Government Intervention in International Trade
Natural Resource Availability
Shift in Supply: Production Costs
changes in the cost of inputs such as labour, raw materials and energy
increase in the price of inputs = increase cost of production = decreased supply
Shift in Supply: Technological Advancements
technological improvements = lower production costs = increased supply
Shift in Supply: Government Policies & Regulations
government policies such as taxes, subsidies and regulations can affect supply
e.g. increased taxes = increased cost of production = decreased supply
e.g. increased subsidies = decreased cost of production = increased supply
Shift in Supply: Natural Disasters & Weather Conditions
natural disasters such as hurricanes and droughts can disrupt production and reduce supply
Shift in Supply: Changes in Expectations
producers may adjust their supply based on their expectations of future prices or market conditions
e.g. if farmers expect coffee prices to rise in the future, they may reduce current supply to take advantage of higher places later
Shift in Supply: Government Intervention in International Trade
trade policies such as tariffs and quotas can affect the supply of imported goods
e.g. imposing tariffs on steel imports can reduce the supply of foreign steel in the domestic market
Shift in Supply: Natural Resource Availability
the availability of natural resources, like minerals and fossil fuels, can impact supply
e.g. depletion of oil reserves = reduction in oil supply
Define price mechanism
The price mechanism is the interaction of demand and supply in the free market, which determines prices. These prices allocate resources efficiently. Adam Smith called this process the ‘invisible hand’
Three functions of the price mechanism
Rationing
Incentive
Signalling
Functions of the price mechanism: rationining
prices allocate scarce resources to those who are willing to pay
at a high price, the good is rationed to those who can afford it
Functions of the price mechanism: incentive
price changes motivate producers and consumers
incentive of producer = maximise profit
incentive of consumer = maximise utility
Functions of the price mechanism: signalling
high price signals producers to enter the market
high price signals a decrease in the utility of money, signalling the consumer to leave the market
Which are the different types of market that the price mechanism is involved in?
local markets
national markets
global markets
Excess supply diagram

Excess demand diagram

Excess demand and excess supply result in a _____________ of ______ resources
misallocation, scarce
Excess supply and demand are fixed by the…
price mechanism
Increased price = ___________ in demand and _________ in supply
contraction
extension
Decreased price = ___________ in demand and _________ in supply
extension
contraction
Fixing Excess demand (e.g. local honey becomes more popular- increased trend)
Excess demand = Qd > Qs
→ there is a misallocation of resourcesExcess demand is fixed by the price mechanism
→ market forces of supply and demand allocate resources with the ‘invisible hand’Price increases
Signal to the producer: The higher price signals to producers that demand has increased and supply is scarce, prompting them to enter the market
Signal to the consumer: Higher price signals decrease in utility for the consumer
Incentive for the producer: Higher price = more profit
Disincentive to the consumer: higher price = lower utility
Rationing: Higher price rations the good to those who can afford it
An increase in price results in a contraction in demand and extension in supply returning the market to equilibrium
Fixing Excess Supply
Excess supply = Qs > Qd
→ there is a misallocation of resourcesExcess supply is fixed by the price mechanism
→ market forces of supply and demand allocate resources with the ‘invisible hand’Price decreases
Signal to the producer: The lower price signals to producers that demand has decreased and supply is in excess, prompting them to leave the market
Signal to the consumer: Lower price signals increase in utility for the consumer
Incentive for the consumer: lower price = more utility
Disincentive to the producer: lower price = lower profit
Rationing: Lower price means good is less rationed
A decrease in price results in an extension in demand and contraction in supply returning the market to equilibrium
Define consumer surplus
The difference between what a consumer is willing to pay and what they actually pay
Define producer surplus
The difference between the price a producer is willing to sell for and what they actually sell for
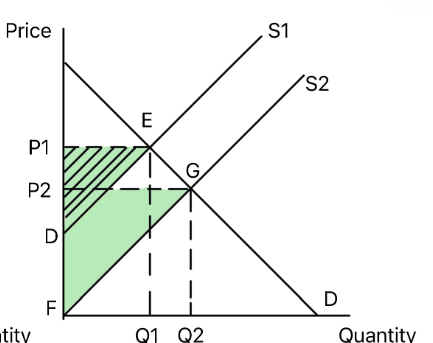
Consumer and producer surplus on a supply and demand diagram

Impact of increased supply on consumer surplus
increased supply = increased consumer surplus:
Consumers pay a lower price and a larger quantity is consumed. The area of consumer surplus has increased from area ABP1 to area ACP2.

Impact of increased supply on producer surplus
increased supply = increased producer surplus
Producer surplus also increases as quantity sold rises, and producers' become more willing to supply at the lower price. The producer surplus has increased from area DEP1 to FGP2.
Impact of increased demand on consumer surplus
increased demand = increased consumer surplus
Consumers are willing to pay more for the good, and more is consumed. The consumer surplus increases from area ABP1 to area CDP2.

Impact of increased demand on producer surplus
increased demand = increased producer surplus
Producers receive a higher price and sell more. The producer surplus increases from area EFP1 to EFP2.
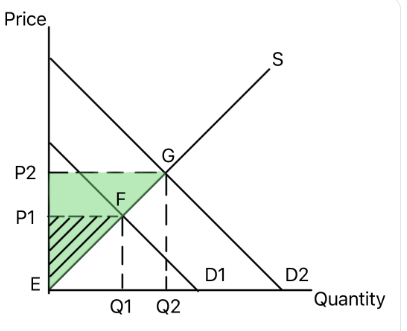
Impact of decreased supply/demand on consumer/producer surplus
decreased supply/demand = decreased consumer/producer surplus
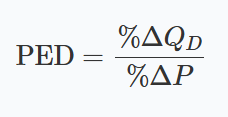
Define price elasticity of demand (PED)
PED measures the responsiveness of quantity demanded to a change in price
PED equation
PED will always be negative because as price increases, quantity demanded decreases
Ignore the negative when using PED value
e.g. PED= -2.6 is used as 2.6
Types of PED
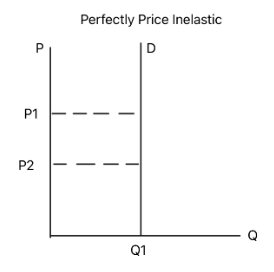
perfectly inelastic
perfectly elastic
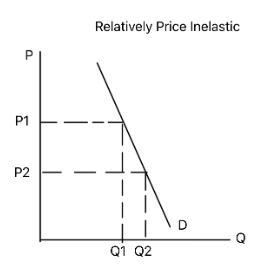
relatively inelastic
relatively elastic
unitary price elastic

PED = 0
Perfectly inelastic
Quantity demanded is unresponsive to price changes
e.g. essential medicine
PED = ∞ (infinity)
perfectly elastic
quantity demanded is extremely responsive to price changes
theoretical

0 < PED < 1
Relatively inelastic
Demand is not (very) responsive to price changes
PED > 1
Relatively elastic
Demand is (quite) responsive to price changes

PED = 1
Unitary elastic
Quantity demanded changes by the exact same percentage as the price

Key determinants of PED
Number & Closeness of Substitutes: More/better substitutes mean higher (more elastic) PED as consumers can easily switch if price rises.
Necessity vs. Luxury: Necessities tend to be price inelastic as consumers must purchase them regardless of price; luxuries tend to be elastic as consumers can forego them if prices rise.
Addictiveness: Addictive goods (e.g., cigarettes) often have inelastic demand because consumers find it hard to reduce consumption even if prices rise.
Proportion of Income: Goods that take a large portion of income tend to be more price elastic as price changes significantly affect consumers' budgets.
Time Period: In the short run, demand is often more inelastic as consumers are slow to respond to price changes. In the long run, demand can become more elastic as consumers find alternatives or adjust their habits.