Psych 1000 - Module 2: Psychological Research
 Call Kai
 Learn
Learn Practice Test
 Spaced Repetition
 Match
Match Flashcards
 Knowt Play
1/35

There's no tags or description
Looks like no tags are added yet.
Name | Mastery | Learn | Test | Matching | Spaced | Call with Kai | Chat |
|---|
No analytics yet
Send a link to your students to track their progress
36 Terms
Scientific Method
Ideas are tested against the real world, and those empirical observations lead to more ideas that are tested against the real world, and so on; the scientific process is circle. Includes:
Deductive Reasoning
Inductive Reasoning
Deductive Reasoning
Ideas are tested in the real world.
starts with a generalization that is tested against real-world observations.
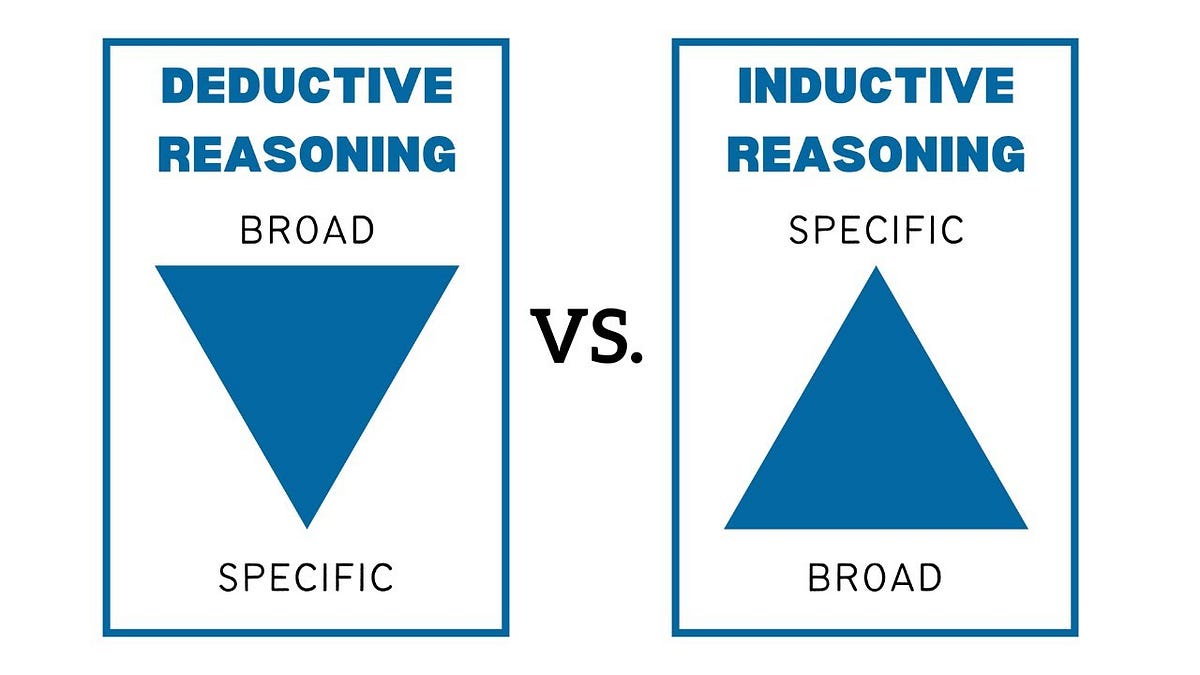
Inductive Reasoning
Real-world observations lead to new ideas.
Uses empirical observations to construct broad generalizations.

Theory
A well-developed set of ideas that propose an explanation for an observed phenomena.

Hypothesis
A testable prediction about how the world will behave if our idea is correct, and is often worded as an if-then statement.
(e.g., if i study all night, I will get a passing grade on the test)

Falsifiable
Capable of being shown to be incorrect.

Survey Research
allows researchers to easily collect data from relatively large samples.

Correlational Research
Can find the relationship between two variables.
Thalamus
A major sensory relay centre in a part of the brain.

Clinical
A large, systematic, controlled study used to test treatments in groups.

Case Study
In-depth, descriptive analysis of a singular patient or small group.

Generalizing
The ability to apply the findings of a particular research project to larger segments of society.

Naturalistic Observation
Observing behaviour in its natural setting.

Benefit of Naturalistic Observation
The validity, or accuracy, of information collected unobtrusively in a natural setting.

Downside of Natural Observation
Often too difficult to set up and control.

Structured Observation
People are observed while engaging in set, specific tasks.

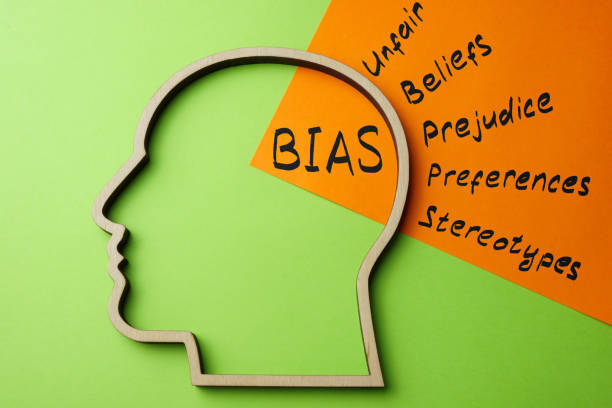
Observer Bias
People who act as observers are closely involved in the research project and may unconsciously skew their observations to fit their research goals or expectations.
Surveys
Lists of questions to be answered by research participants, and can be delivered as paper-and-pencil questionnaires, administered electronically, or conducted verbally.

Sample
A sublet of individuals selected from a population.

Population
The overall group of individuals that the researchers are interested in.

What are the 3 measures of Central Tendency
Mode, median, and mean.

Mode
The most frequently occurring response.
Median
Lies at the middle of a given data set.
Mean
The arithmetic average of all data points.
Benefits of Surveys
We can collect information from a larger sample of people.

Downside of Surveys
Given the greater number of people involved, we are not able to collect the same depth of information on each person that would be collected in a case study.
People don’t always give accurate responses. They may lie, misremember, or answer questions in a way that they think makes them look good.

Archival Research
Using existing records to answer various research questions.
relies on looking at past records or data sets to look for interesting patterns or relationships.

Important Distinctions of Archival Research
The researcher employing archival research never directly interacts with research participants.
The investment of time and money to collect data is considerably less with archival research.
Researchers have no control over what information was originally collected.
Research questions have to be tailored so they can be answered within the structure of the existing data sets.
Longitudinal Research
A research design in which data-gathering is administered repeatedly over an extended period of time.
Cross-Sectional Research
A researcher compares multiple segments of the population at the same time.

Attrition Rates
The reduction in the number of research participants due to dropouts. Very high in longitudinal studies and continue to increase over the course of a project.
Correlation
A relationship between two or more variables, but this relationship does not necessarily imply cause and effect.

Correlation Coefficient
A number from -1 to +1 that indicates the strength and direction of the relationship between variables. Usually represented by the letter r.
NOTE:
Closer to +1 or -1: The more strongly related the variables are, and the more predictable changes in one variable will be as the other variable changes.
Closer to 0: The weaker the relationship, and the less predictable the relationship between variables become.

Positive Correlation
The variables move in the same direction.
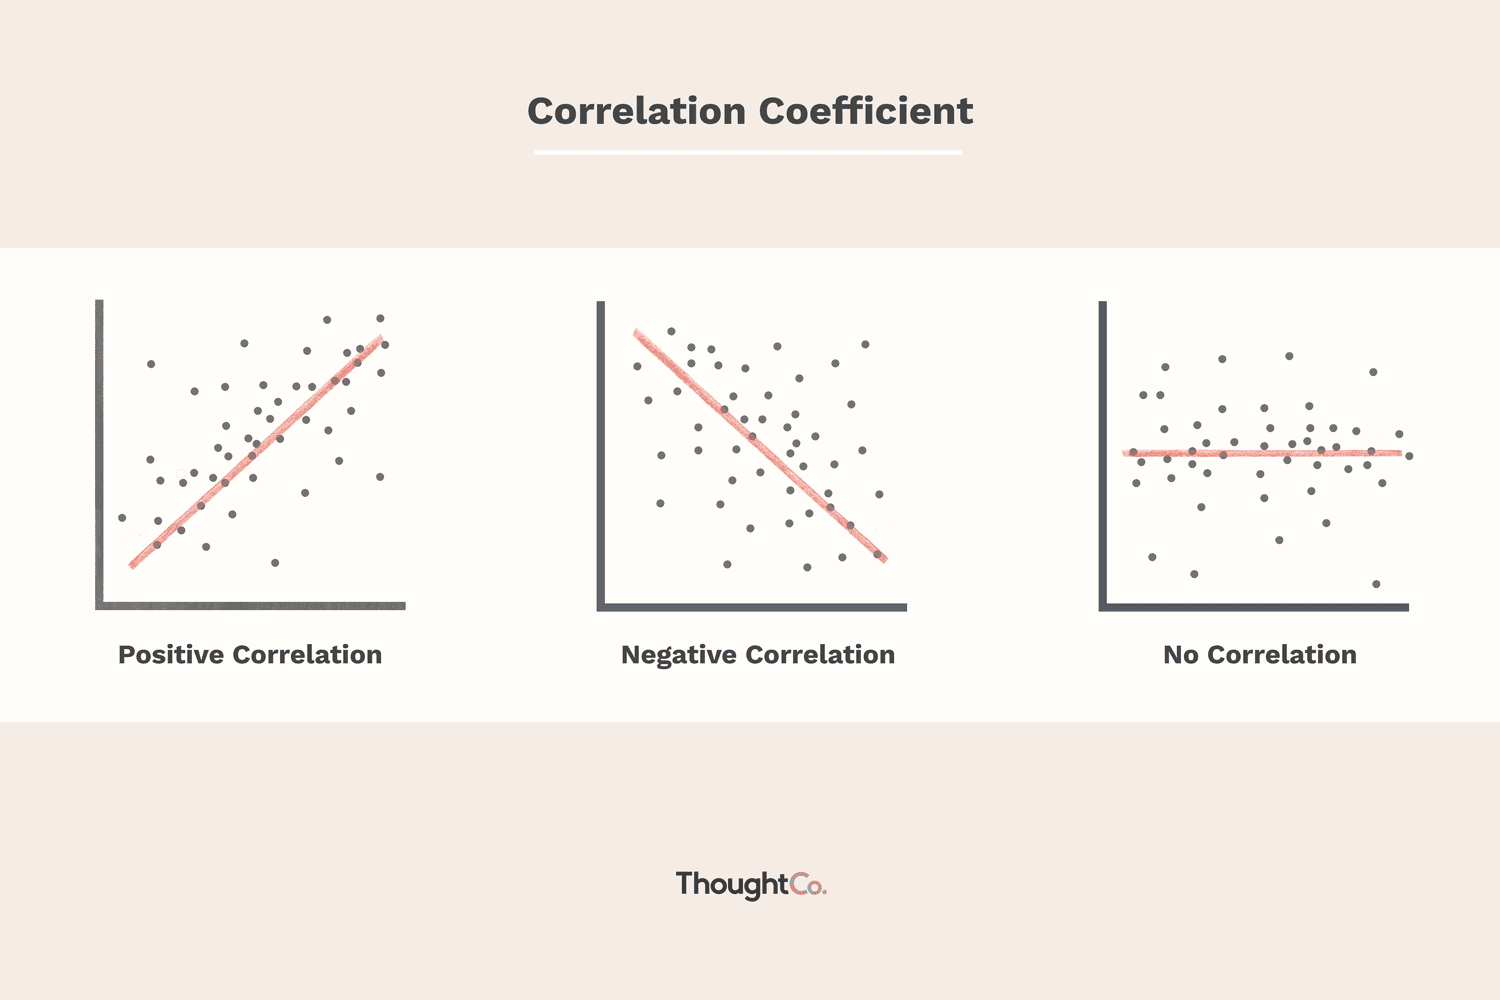
Negative Correlation
The variables move in opposite directions.