BCH210 second half
 Call Kai
 Learn
 Practice Test
 Spaced Repetition
 Match
 Flashcards
 Knowt Play
1/184

There's no tags or description
Looks like no tags are added yet.
185 Terms
Catabolism and Anabolism are Interrelated
Catabolism: breaking things down
Anabolism: buildiing things up

Bioenergetics and Metabolism
Metabolism involves catabolism of compounds, releasing free energy
can be stored in ATP or other high energy intermediates
Anabolic processes syntehsize larger macromolecules using simple building blocks and energy
Gibbs free energy changes (and enzyme) influence the metabolic flux or conversion of metabolites through the pathways
Review of a Chemical Reaction Diagram
Exergonic: substrate energy level higher than product
Endergonic: subtrate energy level lower than product
Activation energy: energy barrier needed to overcome

Gibbs Free Energy and Reactions

Standard Free Energy Change
Keq’ > 1 — Gnaught is negative: exergonic, spontaneous
Keq’ < 1 — Gnaught is positive: endergonic, non-spontaneous
Keq’ = 1 — Gnaught is 0: reaction is reversible

Actual Free Energy Change
Negative ΔG – exergonic, spontaneous
Positive ΔG – endergonic, non-spontaneous
Reactions can be reversible if ΔG = 0
concentration of substrates and products determine diretionality to overcome an unfavourable standard ΔG°′

Thermodynamics and Biochemical Reactions
The Gibbs free energy under standard conditions (ΔG°′ - 1M, 298K, pH 7.0) depends on the nature of the reactants and their concentrations at equilibrium (K’eq)
The cellular Gibbs free energy (ΔG) is dependent on the cellular concentrations of substrate and product and ΔG°′
An enzyme can couple a favourable and unfavourable reaction to produce an overall favourable reaction
Coupled Reactions (or Pathways)

ATP, ADP, AMP

Resonance Stabilization

Resonance Stabilization in Inorganic phosphate
Inorganic phosphate more stable than when attached to ATP

ATP Phosphoryl Transfer Potential
The change in free energy can be used to activate molecules for reactions that are highly unfavourable or found in anabolic pathways
Major issue - how ATP and ADP are remade from ADP or AMP for future use...

Review - ATP
Nucleotide made of adenine, ribose and three phosphates
α, β and γ phosphates: linked by phosphoanhydride bonds and an ester bond to sugar
Involved in both catabolic pathways and anabolic pathways via phosphate group transfer reactions
Free energy change is dependent on the structures and stability of the substrates vs product
Free energy changes not fixed, polar phosphates are ionizable and pH dependent
Metal ions help stabilize ATP
Compounds with similar phosphoryl transfer potentials
no energy change

Phosphoryl Transfer Potential in Muscle — phosphocreatine
Phosphocreatine stores phosphate — can be coupled with phosphate transfer onto ADP to make it energetically favourable
during exercise hydrolyze phosphocreatine
during rest resupplement phosphocreatine

Creatine Kinase Reversibility
Normally more ATP and creatine made
If ATP levels rise, can shift to make more ADP and phosphocreatine

Why do two proteases do the same thing but have different active sites?
Different non-covalent interactions forming
Binding is important for biochemistry
Interactions essential for cellular processes
Binding affinity and kinetics help understand how molecules interact
Binding of molecule is saturable based on stoichiometry
Reversible = non-cova
Irreversible = cova
Many drugs target enzymes based on their ability to bind and inhibit function
Use kinetics to quantify binding
Active Site Specificity
Specificity for single molecule or smal subset of molecules
Homologous enzymes may have evolved from common ancestor with mutations in activity and binding specificity
Understanding structure can help us understand function
Trypsin and chymotrypsin similarities
Have similar tertiary structures but differences in primary sequence
different binding specificities
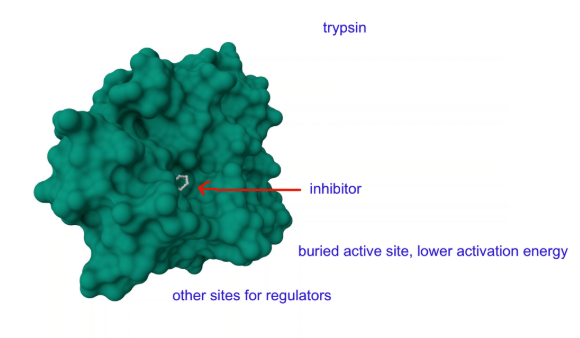
Enzyme-Catalyzed Reactions
Enzymes are biological catalysts that stabilize the transition state, lowering the activation energy so that product(s) can be made
May be represented in suffix (—ase)
Present in small # compared to substrates
Remain unchanged after reaction
MUST be controlled or regulated
Proteolytic Cleavage for Activation — zymogens
Zymogens are inactive enzyme precursors or proenzymes that are activated when needed by proteolytic cleavage (proenzyme —→ functional enzyme)

Zymogen — chymotrypsinogen
Chymotrypsinogen (26 kDa) is an example of a zymogen that is secreted by the pancreas and activated in the small intestine, producing chymotrypsin (1.2 + 14 + 10 kDa)
disulfide bonds keep together
two dipeptides cleaved off (14, 15 + 147, 148)
Proteolytic Cleavage for Activation — proproteins
Proteolytic cleavage can be seen in other proteins
e.g. hormone activation (insulin)
How do Scientists Study Enzymes? Kinetics!
Conversion of substrrate to product can be measured to compare binding affinity and specificity
enzyme kinetics studies rate of reaction = velocity
for simple enzymes, initial rate V0 is measured before substrate conc decreases significantly (or reverse occurs)
Michaelis-Menten kinetics model
Measuring Initial Rates - vo
The velocity or rate of a reaction tells us how fast substrate is converted to product
V0 = d[P]/dt
V0 = -d[S]/dt
[P] = conc of product
[S] = conc of substrate

Monitoring Enzyme Catalysis
Chromogenic substrates generate coloured products which can be measured in order to monitor an enzyme’s activity
e.g. N-Acetyl-L-phenylalanine-p-nitrophenyl ester for chymotrypsin (cuts into coloured product)
measure absorbance A=εcl, then find V0
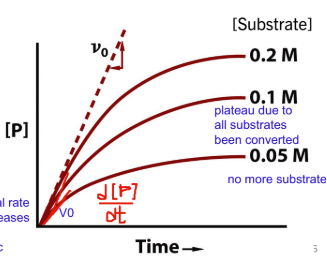
Measuring Initial Rates – vo (constant [E])
Low substrate conc: rate of reaction dependent on conc of substrate (V0 = k[S])
High substrate conc: rate ONLY dependent on conc of enzyme (active sits saturated, reaction rate approaches Vmax. V0 = Vmax)
Michaelis-Menten Kinetics
Only be applied to describe a simple reaction
Interactions between the enzyme and substrate forms the ES complex where a transition state exists, lowering the activation energy
Michaelis-Menten Kinetics Assumptions
Measuring initial rate: [P] < < [S] and no reverse reaction
Rate of ES formation = rate of ES breakdown, no unbinding
Michaelis constant Km
describes the interaction between the enzyme and a specific substrate and comes from the rate constants:

Michaelis-Menten Kinetics Graph
As substrate conc increases, rate of reaction increases
never reaches Vmax — asymptote, always some free enzymes by chance

The Michaelis-Menten equation describes the initial reaction velocity
initial reaction velocity as a function of substrate concentration, or the hyperbolic curve seen in an experiment:
Km = [S] when V0 = ½ Vmax
50% Binding Km = [S]
For simple enzyme-substrate, the Km indicates the concentration of substrate when half of the active sites are bound to substrate (ie. Vmax)
for receptor-ligand pairs, dissociation constand Kd also equal conc when 50% of sites are bound to ligand
binding depedent on non-cova interactions between protein and binding partner
low Km and Kd = tighter binding
Enzymes usually work around Km (or Kd) to adapt to changes in conc
Km is independent of the amount of enzyme present, ie. [Etotal].
Some only bind one molecule
Some bind many, can have different Kms
Key Points - Michaelis-Menten Kinetics
The Michaelis-Menten equation is based on steady-state kinetics
Reactions can be set up to measure vo at varying [substrate], and the results can be used to determine the constants Vmax and Km
As [substrate] increases, the rate of the reaction increases hyperbolically approaching Vmax
The Michaelis-Menten constant, Km, defines the substrate binding affinity and the concentration of [S] at 1⁄2 Vmax
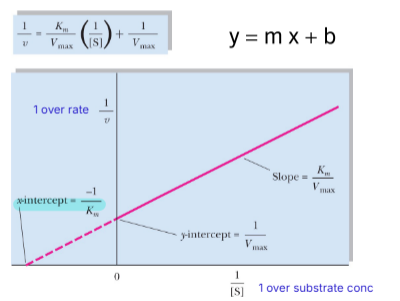
The double-reciprocal Lineweaver-Burk Plot
1 over the entire michaelis mentin equation
because the Michaelis-Menten curve is a rectangular hyperbola, the Lineweaver-Burk transformation must be used to accurately determine Vmax and Km
y-intercept = 1/Vmax
x-intercept = -1/Km
Turnover Number, kcat
Enzyme efficiency can be described using Vmax or more specifically, kcat
kcat is the rate constant when the 100% enzyme is completely saturated
larger = faster production of product

Oxidoreductases
Oxidation-reduction reactions (Cofactors: NADH, NADPH, FADH2 , O2)
e.g. lactate dehydrogenase
2. Transferases
Functional group transfer between molecules
e.g. creatine kinase
3. Hydrolases
Hydrolysis reaction (transfer of functional groups to water)
e.g. trypsin
4. Lyases
Addition or cleavage reactions. Usually involves double bonds and/or cyclization
e.g. adenylyl cylase
5. Isomerases
Group transfer within a molecule
e.g. phosphoglucomutase
6. Ligases
Joining 2 molecules using nucleotides (ATP/GTP etc.)
e.g. biotin protein ligase (BirA)
7. Translocases
Movement of ions or molecules across a membrane (transmembrane proteins)
e.g. flippases
Examples of Enzyme Classification

Why would an enzyme not function properly?
inadequet amounts of cofactor
temperature
pH
inhibitors
Regulating Protein Function
signalling pathways need stimulation or inhibition of enzymes
regulation of enzymes from:
gene expression
proteasome or lysosome (membrane proteins need endocytosis prior to degradation)
structural changes by cleavage (zymogens)
non-covalent or covalent interactions
PTMs (phosphorylation, methylation, acetylation)
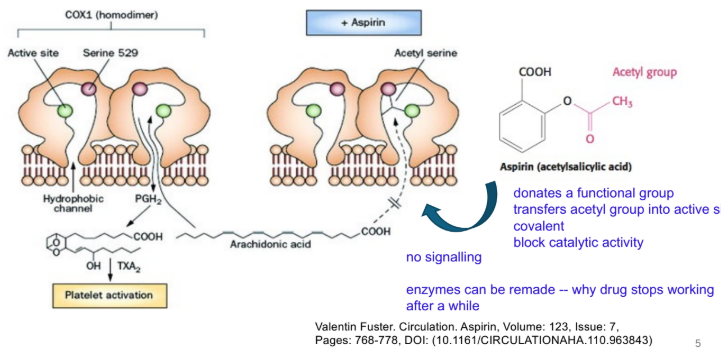
irreversible — molecule bound covalently and cannot be removed
synthesis of new enzyme is only way to overcome inhibition
Irreversible Inhibition Example
transferring groups into active site
enzymes can be remade, why drugs stop working
Simple, Reversible (non-covalent) Inhibition
Reversible can be:
competitive — inhibitor binds to active site
uncompetitive — inhibitor can only bind to enzyme subtrate (ES) complex
non-competitive — inhibitor binds to enzyme or ES complex
Michaelis-Menten kinetics and L-B plot can be used to compare
Simple, Reversible Inhibition chart


Competitive Inhibition
similar structures to substrate
inhibited complex have own binding affinity Ki
.
can overcome inhibitor and reach Vmax with a high concentration of substrate
Vmax doesnt change
Km increase (need more substrate to get half of Vmax)


Un-competitive Inhibition
only bind after subtrate binds (subtrate binding changes structure)
most likely cannot reach Vmax
Vmax decreases
Km decreases
(enzyme out of commision)

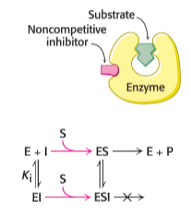
Non-competitive inhibition
inhibitor can bind to free enzyme and ES
most likely cannot reach Vmax
Vmax decreases
Km stays the same
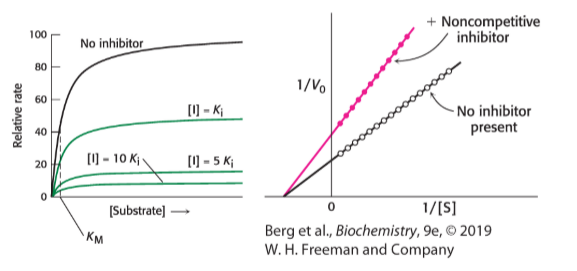
Allosteric Regulation
proteins with quat structure can be regulated by molecules that bind to allosteric sites distant from active site
stimulatory or inhibitory
binding of allosteric regulators result in conformational changes in other subunits that affect binding of ligand (binding of one subunit changes structure of other subunit)
Tense/Taut (T) = no work
Relaxed (R) = work
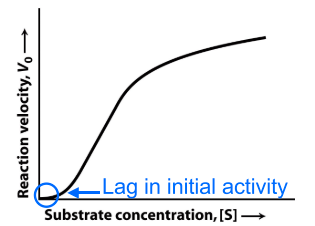
display sigmoidal (s-shaped) kinetics (indicates cooperativity of binding of subtrates to adjacent active sites)
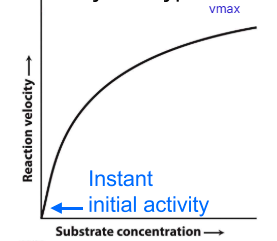
Michaelis-Menten enzyme: hyperbolic
Allosteric enzyme: sigmoidal
need molecules to bind T state before R state is formed
regulatory molecules needs to come along
makes lag in beginning
Cooperativity
binding to allosteric site or substrate binding = change in conformation
quick increase after
until active sites saturated

Type 1 diabetes mellitus (T1DM)
Autoimmune disease, beta cells of pancreas are destroyed, no production of insulin
insulin is a hormone that regulates blood glucose levels and metabolic pathways
Carbohydrates are hydrated carbons
General chemical formula = (C·H2O)n
suffix: -ose
vary in size and structure
can be modified — dramatically increases complexity (e.g. glyoproteins)
in many biological and physiological processes
Carbohydrates are also a source of energy
One of the energy-producing macronutrients from diet
Recommended Dietary Allowance (RDA) = 130g/day
amount of glucose used by neurons each day
Naming and describing carbohydrates
One carbohydrate = a monosaccharide
aldoses — aldehyde group
ketoses — ketone group

Numbering carbohydrates
Triose, tetrose, pentose, hexose most physiologically relavent
Number from most oxidized to least oxidized, in its linear form
aldose — count from aldehyde carbon
ketose — ketone is 2nd carbon

Carbohydrates often have chirality
In a Fisher Projection:
if the –OH is on the left = l
if the –OH is on the right = d
L or D assigned to the asymmetric, chiral carbon furthest away to the carbonyl
body prefers D isomers
There are endless carbohydrate isomers
# of isomers = 2n (n = number of chiral centres)
equal amount of D and L isomers
Why does the position matter?
Enzymes have evolved for very specific molecules, tight binding needed
other sugars cannot bind certain bonds
weakening binding
Glucokinase Km
Glucose = 6~10mM
Galactose = not measureable (OH group pointing up)


Carbohydrates can form rings...
Aldehydes, ketones and hydroxyl groups are very reactive
Intramolecular hydroxyl groups attacks the carbonyl group, forming ring
Bond is:
hemiacetal — aldehyde derivative
hemiketal — ketone derivative
Numbering is retained in ring form
Cyclization forms anomers and is reversible
Cyclization results in the formation of 2 additional chiral structures (anomers)
alpha — OH under ring
beta — OH above ring
beta glycose prefered — hydroxyl groups furthest away
Intramolecular cyclization is reversible in solution
Linear carbohydrates are reducing sugars
A reducing sugar is a carbohydrate that contains a free aldehyde or ketone group
can act as a reducing agent by donating electrons to another molecule (oxidizing agent) to become oxidized
very reactive due to free carbonyl group
cyclic sugars need free OH on anomeric carbon to convert back to carbonyl linear form
Hemoglobin A1C
Reducing sugars will react with other proteins and lipids spontaenously, contributing to disease
glucose in blood will react spontaneously with N-term valine on hemoglobin = glycated hemoglobin (glycation)
normal red blood cell life-span = 90-120 days
normal: less than 6% glycated
prediabetes: 6-6.4%
diabetes: greater or equal to 6.5%
More glucose = more glycated hemoglobin
Glycosidic bonds hold carbohydrates together
Monosaccharides joined by glycosidic linkages to form disaccharides and complex structures
catalyzed by enzyme
condensation/hydrolysis reactions (water made/water needed)
Glycosidic bonds are also ⍺ or β
alpha bond = above ring
beta bond = below ring

Variations of Glycosidic bonds: N- or O-linked
N-linked or O-linked glycosidic bonds
intermolecular glycosidic bonds formed between amine or hydroxyl and reactive anomeric carbon
DNA RNA nitrogenous bases
glycoproteins O-linked (ser/thr) or N-linked (asn)
Carbohydrates can be complex
Monosaccharides – 1 sugar
Disaccharides – 2 sugars
Oligosaccharides – 3 to 20
Polysaccharides – up to 1000s
Polysaccharides can serve many functions
energy storage, cellular structure, protein recognition
linear or branched polymers
glycans
homopolymer: same monosaccharide (e.g. startch, cellulose, glycogen — homogylcans)
heteropolymer: different monosaccharides (e.g. sugars found in glycoproteins (heteroglycans)

Starch – energy storage in plants
Amylose:
unbranched glucose units (linear)
alpha(1,4) linkages
Amylopectin:
linear glucose chains joined by a-1,4 linkages
branch points every 30 glucose units by a-1,6 linkages
Humans can hydrolyze starch to release free glucose molecules for energy
Polysaccharides can form helical shapes

Glycogen – energy storage in animals
A storage form of long, branched chains of glucose
linear a-1,4 linkages
branch points every 8-12 glucose units by a-1,6 linkages
Contains glycogenin dimer at centre — preventing reducing ends from interacting
Glucose units added and removed from non-reducing ends (for energy)
Found in the liver and muscle
Glycogen diagram


Cellulose – structure and support
Most abundant organic compound, structural role in plants
Unbranched chains joined by b-1,4 linkages
Forms layers, many hydrogen bonds provide strength
Cellobiose is a disaccharide of glucose linked by β(1→4)
Humans cannot hydrolyze cellulose
Protein Recognition of Sugars
Amino acid side chains in the active sites of enzymes confer specificity through non-covalent interactions
Digesting carbohydrates
Cells can only transport and use monosaccharides
disaccharides/polysaccharides must be broken down by digestive enzymes before absorption and usage
α-amylase, maltase, isomaltase, lactase and sucrase
no cellulase enzyme
released by salivary glands, pancreas, and embedded in enterocytes in microvilli to help absorption
Digesting saccharides pathway
a-amylase in saliva
enzymes denatured in stomach and reabsorbed
new digestive enzymes in small intestine
absorbed = energy
anything cant digest = excreted

Digestion diagram

Digesting starch

Maltase and Lactase example
Maltase cleaves a-1,4 bond = glucose + glucose
Lactase cleaves b-1,4 bond = galactose + glucose
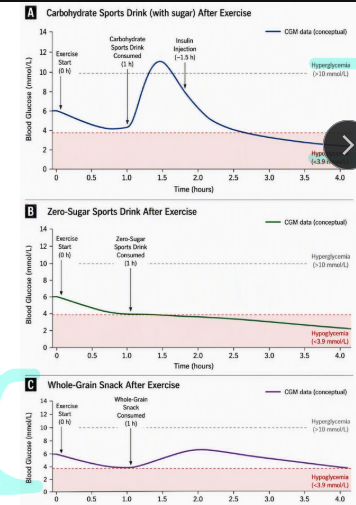
Diabetes and diet
Sugary drink
Zero-sugar drink
Whole-grain snack

Transporting glucose
Moving glucose around the body is critical
very polar, cannot diffuse through lipid bilayer
transporters help move based on concentration gradient and binding affinity
Different cells will use different glucose transporters
Sodium-Glucose Co-transporters — against gradient, secondary active transport
Glucose transporters — with gradient, facilitated diffusion
Fructose transporters — with gradient, facilitated diffusion
(high conc outside cell, low conc inside)
A few of the glucose transporters
SGLT — use sodium for secondary active transport
GLUT — facilitated diffusion
GLUT 4 — insulin dependent, expose to cell surface with receptor binding

Working together to transport glucose
Highest conc gut lumen
higher conc in cell
low conc outside cell

glucose transporters in brain
blood — GLUT1 — intracellular space
GLUT 3 — into neuron
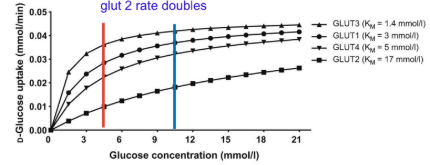
Fasting – Blood Glucose = 4-5.5 mM
GLUT 1 & 3 close to max rate (BBB and neurons)
GLUT 2 not alot, no insulin released
GLUT 4 not on cell surface

Fed – Blood Glucose = 6.5-11.1 mM
Rate increases
GLUT 3 almost max
GLUT 1 increases
GLUT 4 increases
GLUT 2 rate doubled — releases insulin
Anabolism vs Catabolism
Catabolism — break down molecules (releases energy, can produce ATP)
Anabolism — build up more complex molecules (requires energy, proteins & DNA)
Metabolism = Catabolism + Anabolism
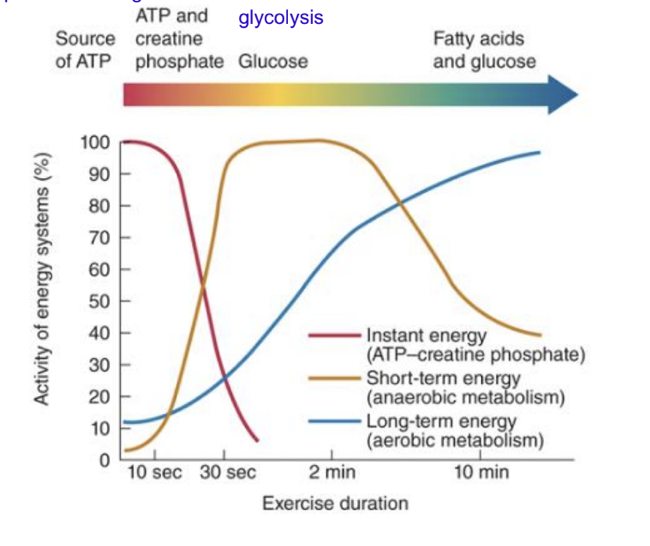
Sources of energy during exercise
ATP
regeneration of ATP from phosphocreatine
glucose glycolysis (anaerobic)
fatty acids and glucose (aerobic metabolism)

An overview of glycolysis
10 step pathway (anaerobic)
uses glucose and other monosaccharides
in cytoplasm
present in almost all organisms
pathway is exergonic under standard and cellular conditions
produces a small amount of ATP very quickly
Overview of glycolysis pathway
Starts with glucose (6-carbons, hexose)
Stage 1: preparation, needs energy (steps 1-5)
2 ATP are used to prepare glucose molecule for breakdown
generates 2 GAPs (3-carbons, triose)
Stage 2: extract energy (steps 6-10)
produces 2 pyruvate (3-carbons), 2 NADH, 4 ATPs (2 NET ATP)
substrate-level phosphorylation
Glycolysis substrates and products
