All sections of RML: Variables, Null Hypothesis, P-Value, correalations and coefficients, Results, Discussion & Abstract
 Call Kai
 Learn
 Practice Test
 Spaced Repetition
 Match
 Flashcards
 Knowt Play
1/48

There's no tags or description
Looks like no tags are added yet.
49 Terms
Whats is a Variable?
Is something that varies
• Because it varies, it must have at least two levels (or at least two values) ex. Gender, GPA, Age, Self‐esteem, IQ, Life‐satisfaction
Conceptual definition (construct)
A researcher’s definition of a variable at an abstract/theoretical level
• Example: personality, infant temperament, anxiety
Operational definition
– the specific way in which a concept of interest is measured or manipulated as a variable in a study.
Construct example
Child’s physical agression
Operationalization of a child’s physical aggression
Teacher Questionnaire and Observe Child’s Behavior at School
Scales of Measurement- Categorical
assign numbers to categories (nominal), arbitrary. ex. Gender and Hair color
Scales of Measure-Quantitative
meaningful numbers. ex.Score on a depression inventory, Number of times a child hits or kicks another child, and GPA
Measured variable
A variable that is observed and recorded
• Examples: height, IQ, gender, hair color, depression, stress
Manipulated variable
A variable where levels are controlled by assigning participants to various levels of that variable
• Example: Testing environment ‐ randomly assigning participants to take a test in either a quiet or chaotic environment
Variables
Some variables can only be measured—not manipulated
• Examples: Age, quality of a particular school
Some variables can be either manipulated or measured
• Example: quality of the testing environment
Variables in an Experiment
An Experiment is a research method in which the researcher systematically
manipulates one variable and measures the other variable, while holding
other variables constant.
**Good experiments are the only way we can make causal claims between variables**
Independent variable
The variable that is systematically manipulated by the researcher to produce changes in the outcome (dependent variable).
• Random assignment must be used when assigning to groups
Dependent variable
The outcome or response that is being measured
Does the quality of the testing environment affect test performance?
What is the independent variable?
The testing environment
• How would we manipulate this? Two levels/conditions: quiet or chaotic
Does the quality of the testing environment affect test performance?
The dependent variable?
Test performance
• How would we measure this? The participant’s score on the test. The scores
would be on a scale from the lowest to highest possible score.
Participants-descriptive statistics
The sample (participant demographics)
Materials
• Describe how each variable was operationalized and measured, including the scale
Procedure
• Describe the procedure (what were participants asked to do)
SPSS stands for
“Statistical Package for the Social Sciences”
abbreviations for statistics (italicized)
N=sample size (total sample for the study)
n=all other participant numbers (e.g., number of participants in a group)
M=mean, SD=standard deviation
Greek letters are not italicized
Categorical data
• Report the n (number) and % for each category (e.g., for males, females, intersex)
• For presenting percentages, use “Valid Percent” in SPSS output
Quantitative data
•Report the M and SD
• Always include units! Example: Age (years)
• Always include SD with M; always include n with %
Hypothesis testing
is the process of determining an answer to our research question through probability.
Null hypothesis statistical testing (NHST)
Is a commonly accepted, standard way of testing psychological hypotheses.
• “Null” means 0 or nothing
• The null hypothesis therefore means that there is no relationship between the 2 variables in the population and that the controlling variable has no effect on the other.
NHST
What is the likelihood (or probability) that we find an association between variables in our sample if H0 is true in the population?
all‐important p‐value*
The purpose of statistical analyses is to determine the likelihood of getting a specific result IF H0 is true
• In this lab, we will focus on the p‐value. The p‐value tells us the likelihood that an association between variables occurred due to andom chance (i.e., IF H0 is true )
• In behavioral sciences, a commonly accepted standard cut‐off point for the p‐value is .05.
If the p‐value is less than .05,
We reject the null hypothesis.
• This means the likelihood of getting a specific result IF H0 is true is very small.
• Therefore, we reject the assumption that H0 is true. We reject H0.
• We say that the association between the variables was probably not due to random chance and is therefore statistically significant.
• Note: The p‐value can never be 0. If you see p=0 in your SPSS output, report p < .001
Dr. Y’s research hypothesis is that disengaged
parents are more likely to have anxious kids.
• The results: kids of disengaged parents score 0.5
points higher on average on an anxiety scale and p‐value is .10.
• Reject or fail to reject the null?
• Fail to reject
• Were the results statistically significant?
• No
• Was the research hypothesis supported?
• No
Dr. Z’s research hypothesis is that disengaged
parents are more likely to have anxious kids.
• The results: kids of disengaged parents score 0.5
points lower on average on an anxiety scale and p‐value is <.001.
Reject or fail to reject the null?
• Reject
• Were the results statistically significant?
• Yes, the p‐value was less than .05
• Was the research hypothesis supported?
• No, the results were in the opposite
Dr. X’s research hypothesis is that the
amount of time watching TV is positively associated with obesity.
• The results: r is +0.35 and p‐value is .002.
Reject or fail to reject the null?
• Reject
• Were the results statistically significant?
• Yes
• Was the research hypothesis supported?
• Yes
Dr. Y’s research hypothesis is that disengaged
parents are more likely to have anxious kids.
• The results: kids of disengaged parents score 0.5
points higher on average on an anxiety scale and p‐value is .10.
Reject or fail to reject the null?
• Fail to reject
• Were the results statistically significant?
• No
• Was the research hypothesis supported?
• No
my hypothesis is that people who were born in the south are more likely to prefer sweet food,
compared to people who were born in the north.
What is the null hypothesis? What is the research hypothesis?
• People are equally likely to prefer sweet food whether from the north or south
• People who were born in the south are more likely to prefer sweet food than people born
I conducted a between‐groups study in which I asked people
where they were born and then had them pick out their favorite food from a list.
• What are two variables? • Is this an experiment? Why or Why not?
• Place of birth (North or South)
• Preference for sweet food (measured by choosing favorite food)
• NOT an experiment
• You can’t randomly assign where a person was
I conducted an ANOVA (you’ll learn this term soon)
and obtained a P‐value of .07.
• Do we reject or fail to reject the null hypothesis?
• Fail to reject.
• Was our research hypothesis supported?
The p‐value is greater than .05, which means that any
relationship between place of birth and preference for
sweet food occurred by random chance and likely does
not actually exist in the population.
• No, there is no statistical significant difference in sweet
preference between people born in the
Between‐Groups ANOVA*(Analysis of Variance) and T‐test
1 categorical variable
1 quantitative variable
Mean difference Is there a difference in the means across groups?
Chi‐square (X2 )
2 categorical variables: Pattern of relation
Does membership in one
category predict membership of another category?
Correlation
2 quantitative variables Linear
If scores on one variable increase (or decrease), does the other variable increase
contingency table.
Pearson’s Correlation (r)
reported as r
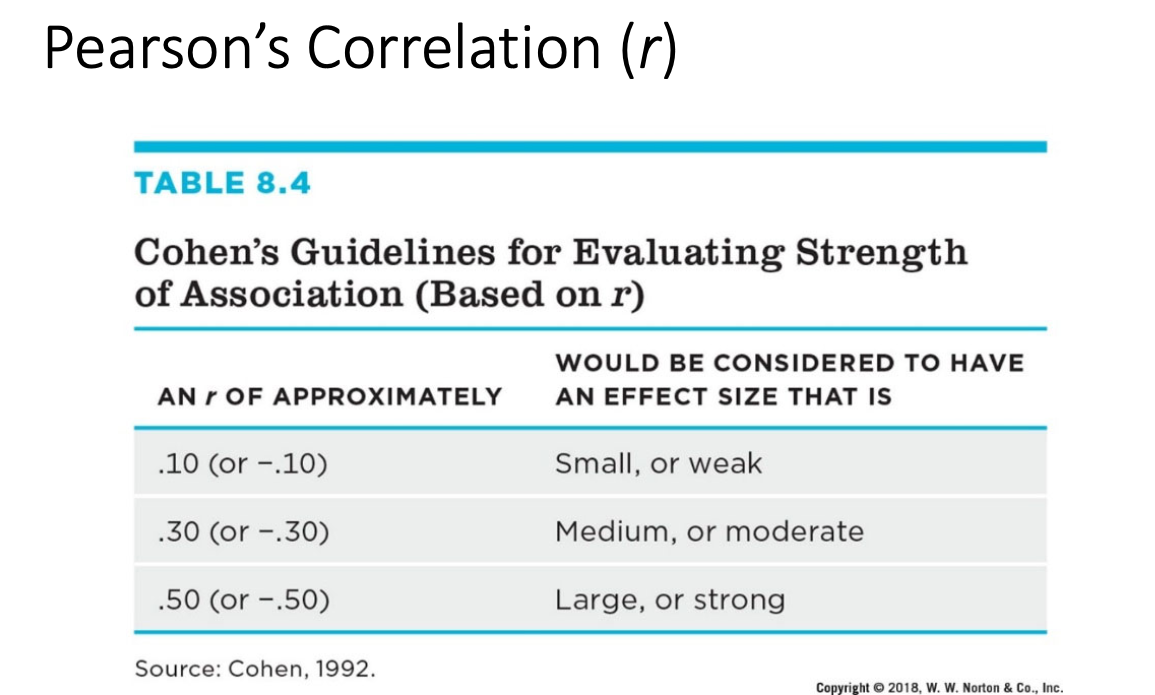
The Pearson correlation coefficient (r) tells us the direction and strength of the linear relationship
• Direction: Correlations can be positive or negative.
• A positive correlation between two variables means that, as one variable increases, so does the other
• A negative correlation between two variables means that, as one variable
increases, the other decrease
Pearson’s Correlation (r)
Possible r values range from ‐1.00 to 1.00
Values closer to 1.00 or ‐1.00 are stronger. Values closer to 0 are weaker.
Dr. X’s hypothesis is that the number of hours
watching TV is positively correlated with a
person’s weight.
• Results: r = .65, p= .02.
• What are the two variables?
• Is the correlation positive or negative?
• Weak or strong?
• Significant or not?
• Is Dr. X’s hypothesis supported?
Variables: Number of hours watching TV and a person’s weight.
Correlation is positive
Strong or moderate
Is significant
Yes Dr. X’s hypothesis is supported
Dr. Z’s hypothesis is that the number of
friends someone has is not correlated with
happiness.
• Results: r = ‐.06, p = .79.
• What are the two variables?
• Is the correlation positive or negative?
• Weak or strong?
• Significant or not?
• Is Dr. Z’s hypothesis supported?
Variables: Number of friends and happiness.
Negative correlation
Weak
Not significant
Yes Dr. Z’s hypothesis is supported
Dr. Y’s hypothesis is that parents’ rating of
disengagement is positively correlated with
their kids’ anxiety score.
• Results: r = .17, p = .10.
• What are the two variables?
• Is the correlation positive or negative?
• Weak or strong?
• Significant or not?
• Is Dr. Y’s hypothesis supported?
Variables: Parents’ rating of disengagement and the kid’s anxiety score
Positive correlation
weak
Not significant
No the hypthesis is not supported
ANOVA results
– Bar Graph
• A bar graph is commonly used to present the results of ANOVAs/t‐tests
• In a bar graph, we present the mean for group 1 and the mean for group 2
Correlations results
Scatterplot
• A scatterplot is commonly used to present the results of correlations
• In a scatterplot graph, each point represents one participant.
X^2 Results
– Contingency Table
• A contingency table is commonly used to present the results of X^2 analyses
• Particularly useful when there are multiple X^2 analyses to report
• In the contingency table, the pattern of results are presented.
Strengths, limitations, future directions
Construct validity
Quality of the measures and manipulations
Statistical validity:
Statistical conclusions are appropriate and
reasonable.
Internal validity
No alternative causal explanations for the outcome
External Validity
To whom, what, or where can we generalize?