FUCKING JOEL ROSS BULLSHIT
 Call Kai
 Learn
 Practice Test
 Spaced Repetition
 Match
 Flashcards
 Knowt Play
1/33

There's no tags or description
Looks like no tags are added yet.
34 Terms
P Value < alpha
REJECT THE NULL
chance of obtaining this result without an affect is low
P Value > alpha
DO NOT REJECT THE NULL
chance of obtaining this result without an affect is high enough to dismiss the alternate hypothesis
PARAMETRIC Tests
Z SCORES
ONE SAMPLE T-TESTS
T-Test and Paired T-Test
ANOVA
2-Way ANOVA
Regression and Correlation
When to Use Parametric Tests
when data is normally distributed
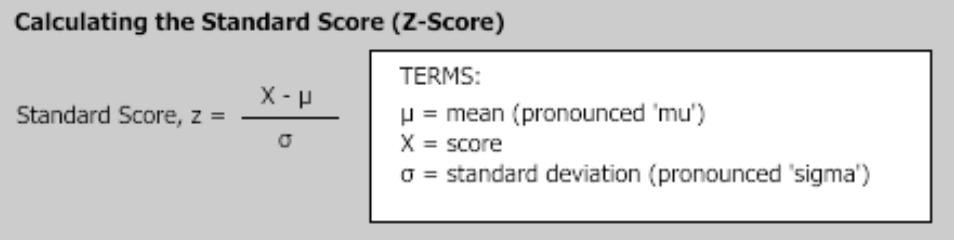
Z Scores (or Standard Score)
determine how a value compares to the population
percentile or rank
Standard Deviation must be known
you need a Z table
NORMAL DISTRIBUTION
One Sample T-Tests
determine if a sample MEAN is different from a known value
used when Standard Deviation is NOT known
produce a t-value
NORMAL DISTRIBUTION

t-Value
compare this value to the Critical t (threshold value similar to alpha)
t-value > critical t → reject the null
NON-PARAMETRIC
One Sample Wilcoxin Test
Mann-Whitney U-Test
Kruskal-Wallis Test
Spearman Correlation
One-Sample Wilcoxon Test
compares sample MEDIAN of non-normal data to a known value
assumes variable is continuous and the data are symmetrical
Normality Tests
visual assessment
statistical test
Anderson-Darling Probability Plot Test
Independent Samples vs Paired Samples
Independent Sample = two different sets of items/groups
Paired Sample = multiple measurements for one set of items/group
Sample Two Variances Tests
Bonett’s Test → better suited to normal data sets
Levene’s Test → better suited to skewed data sets
Interpreting Variance
EQUAL VARIANCE = data have different means but similar standard deviations (p>0.05) Supports the H0
UNEQUAL VARIANCE = data have different means and different standard deviations (p<0.05) supports the HA
Two-Sample T-Test
Assumptions:
independent
normal distribution
two statistically equal variances
Modified One-Sample T-Test for paired samples:
0 = mean difference ~ H0 and mean difference =/= 0 ~ HA
Anderson Darling Test
Used to interpret probability plots to determine if its a normal distribution
the p-value from the AD test p>0.05 supports H0 (no difference from a normal distribution)
Type I Error → THE MULTIPLE COMPARISONS PROBLEM
falsely detecting a difference
can be the result of doing multiple t-tests for 3 or more groups, if we do multiple tests the chance that one will be wrong increses
Solving the Multiple Comparisons Problem
Solution 1 → adjust the alpha or p value
BONFERRONI CORRECTION
Solution 2 → test designed for multiple comparisons
Analysis of Variance (ANOVA)
Bonferroni Correction
uses an adjusted alpha value
this is not the best solution for comparing 3 or more groups
can increase the likelihood of Type II errors (false negative)

ANOVA - Analysis of Variance
Assumptions:
independent data
normal distribution
equal variance
compares all groups together rather than stepwise
4 Types of ANOVA:
One-way ANOVA
Repeated Measure ANOVA
Factorial ANOVA
Multivariate ANOVA
ANOVA Hypothesis
if the null hypothesis is true any differences in the means could be explained by chance alone
p<0.05 → reject the null (at least one mean is different)
One-Way ANOVA
one dependent variable with 3 or more variants of an independent variable
each variant is independent
Repeated Measures ANOVA
used when variants are not independent
one dependent variable, one independent variable with 3 or more variants which are not statistically independent
Factorial ANOVA/Two-Way ANOVA
2 or more independent variables (factors) with 2 or more variants each
for a total of 4 or more means compared to one dpenedent variable
Multivariate ANOVA (MANOVA)
2 or more dependent variables, used to examine multiple dependent variables
multiple types
Mann-Whitney U-Test
Assumptions:
independent variables
non-normal distriution
Pairwise Comparisons
these are used to compare the means within a ANOVA test to help determine which groups are different to properly reject the H0
These are done using POST-HOC TESTS
Post-Hoc Tests
Most common:
Tukey → used when all samples are compared to each other
1vs2vs3vs4
Dunnett → only used when comparing to a control
Kruskal-Wallis Test
used when ANOVA assumptions are not fully met (either in normality or variance)
a variant of Mann-Whitney U Test
Posthoc comparison by Dunn’s Test
Correlation/Regression Analysis
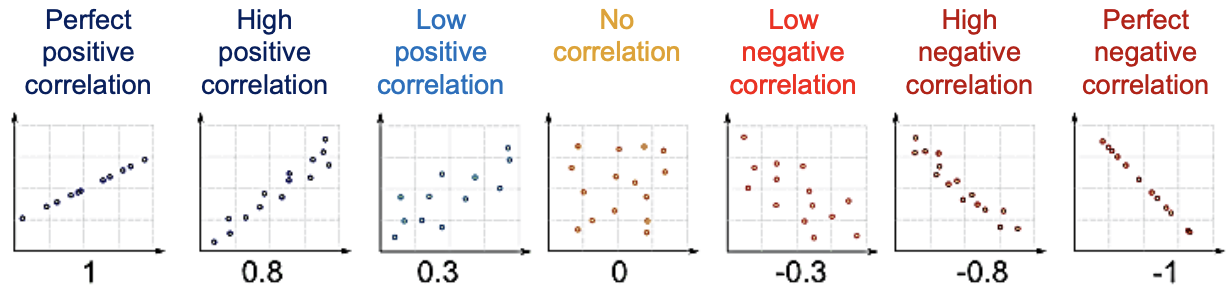
calculates the correlations coefficient (r’)
Correlation Coefficient (r’)
ranges from -1 to 1
LINEAR RELATIONSHIPS:
the magnitude of r (the numerical digit) indicates the strength of the relationship
the direction (+/-) indicates whether the slope is positive or negative
r=0 means non-linear relationship
also known as Pearsons r
Spearman Correlation
used to access monotonic (variables that change together but with varying rates) relationships
for non-linear relationships
Regression Coefficient (r2)
quantifies the degree to which variation in one variable is related to variations in the other variable
percentage range
% variation in A is mathematically related to B
Correlation and Regression Assumptions
the scatterplot is linear (use the line of best fit)
data normality (test via probability plot)
Regression Only:
residual normality (test via probability plot)
residual plots are evenly distributed along the plotted line (variance is equally distributed across values)
Error of Regression: RESIDUALS
the vertical distance of each point from the line of best fit