1042 Final Exam EPI
 Call Kai
 Learn
 Practice Test
 Spaced Repetition
 Match
 Flashcards
 Knowt Play
1/269

There's no tags or description
Looks like no tags are added yet.
Name | Mastery | Learn | Test | Matching | Spaced | Call with Kai | Chat |
|---|
No analytics yet
Send a link to your students to track their progress
270 Terms
What is the aim of Public Health?
The attempt to improve/maintain the health and well-being of individuals, communities and whole populations.
Aims to:
Improve the health of an entire population
Reduce health inequalities in a population
Step beyond the individual-level focus of mainstream medicine
Also includes trying to prevent problems from arising or growing by ‘running upstream’ to find and change the root cause
*Important tools are Epidemiology & Biostatistics
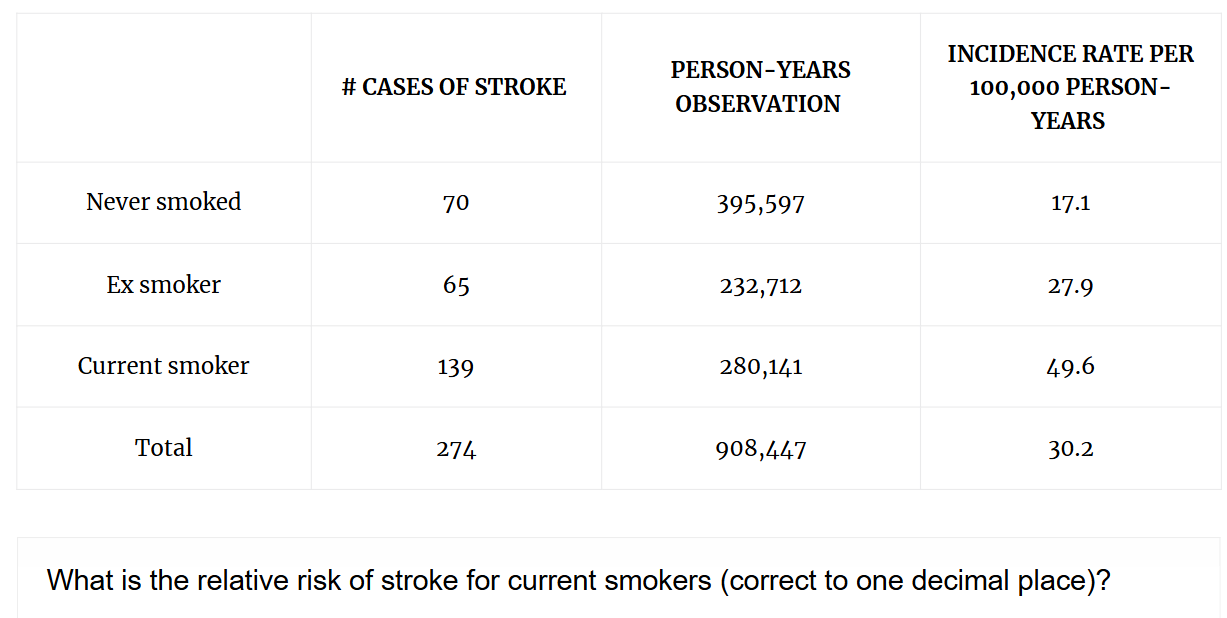
Qs involving the incidence rate
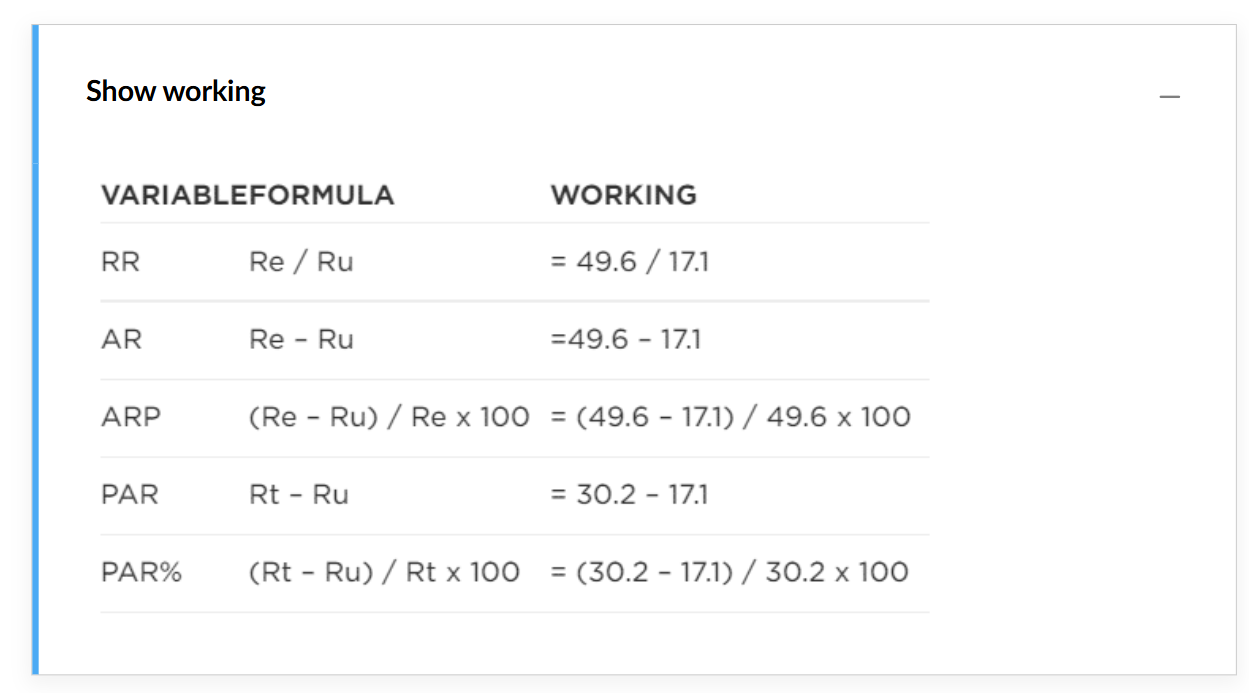
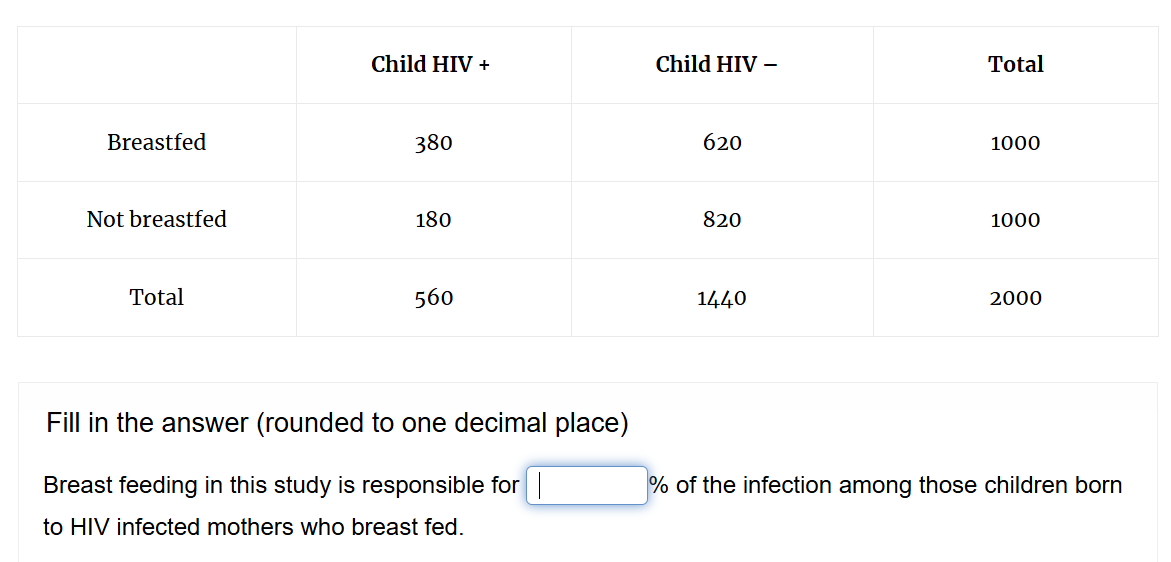
Example of AR
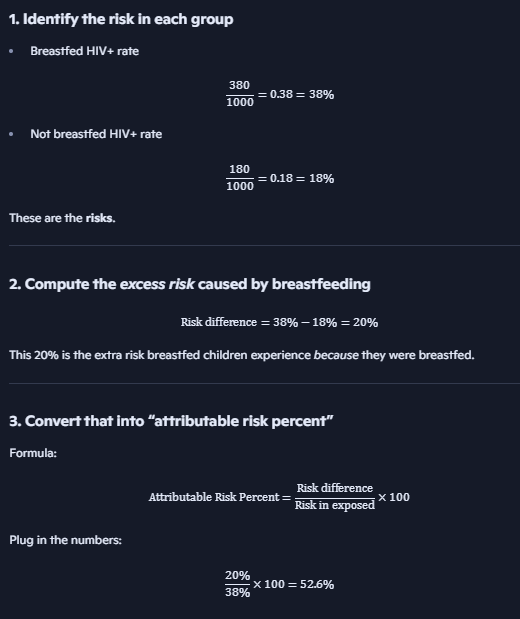
What is Attributable Risk (AR)
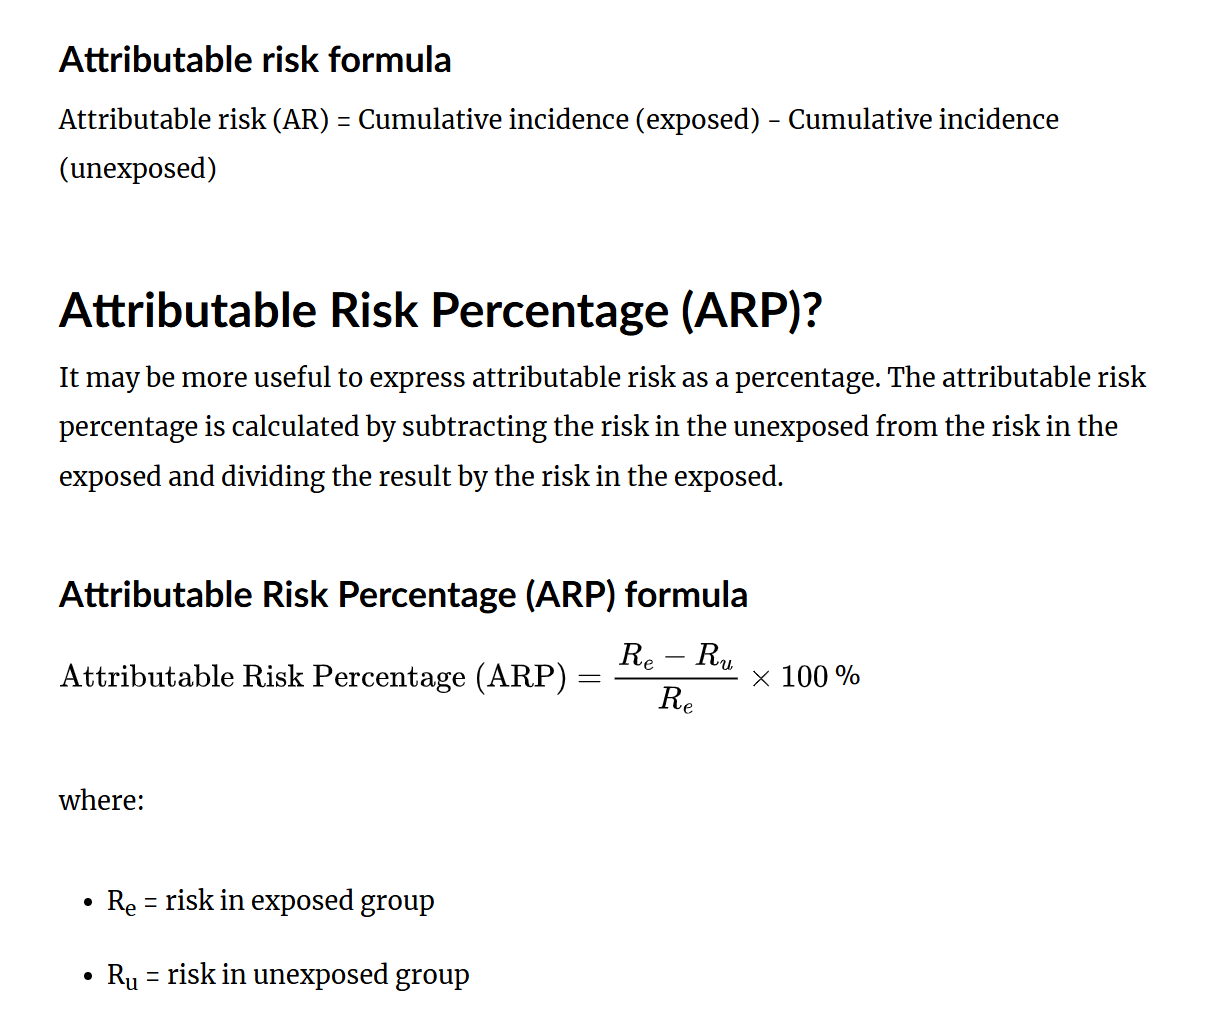
The Attributable Risk (AR) or risk difference is a measure of the absolute difference between the two measures of disease frequency
AR focuses on the excess risk of disease in those who are exposed compared with those who are not exposed
A relative risk (RR) calculates a ratio between the two cumulative incidences, whereas the attributable risk (AR) calculates the difference between the cumulative incidence in the exposed group from the cumulative incidence in the unexposed group


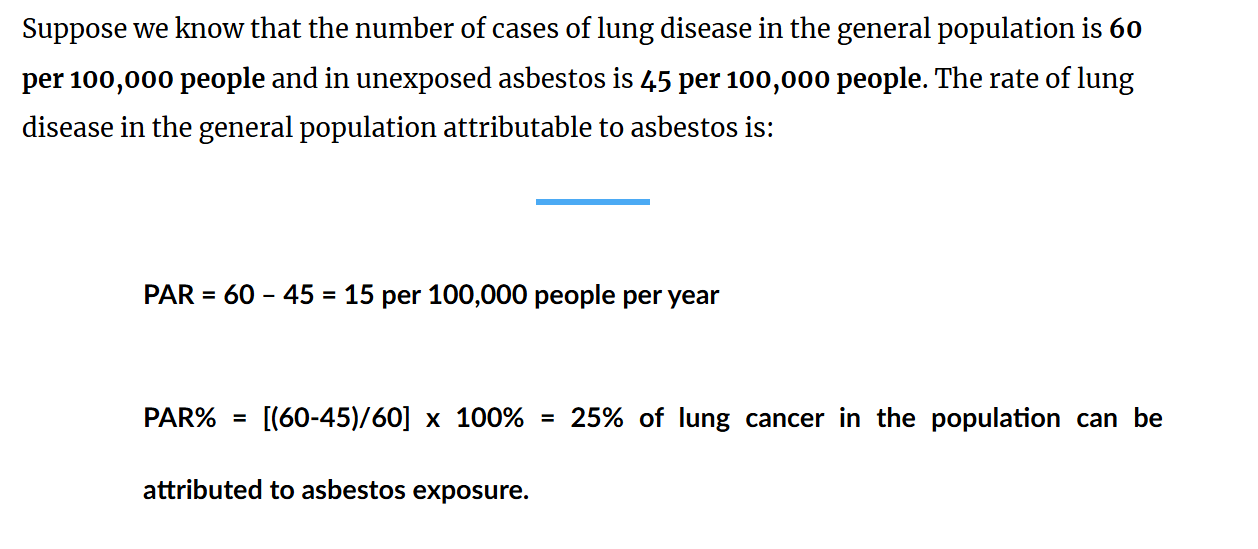
What is the Population Attributable Risk (PAR)?
To calculate the PAR, we subtract the rate of the disease in the unexposed group from the rate of disease in the general population
This tells us the number of cases of disease that would be eliminated from the general population if the exposure were eliminated

What is and how do we calculate the Odds Ratio (OR)
We cannot calculate relative risk directly from case control studies as they do not produce incidence rates due to the fact that we start with the outcome of interest
Remember relative risk = incidence in exposed/ incidence in unexposed
Instead we produce odds ratios, which can approximate relative risks if the disease is relatively rare (<5%) and when the cases are from the same population as the controls
The odds ratio compares the "odds of exposure in cases" to the "odds of exposure in controls"
The interpretation is the odds of exposure in cases is ___ times that of controls


What is the Hazard Ratio (HR)?
Hazard ratios (HR) help measure the effects of an intervention on an outcome of interest over time
The outcome of interest may be positive (discharge/disease free) or negative (relapse/death)
HR helps us understand how long it takes for a particular outcome to occur
Hazards Ratios are not relative risks, with the main difference between the two being that relative risk does not take into account the timing of the event but only the occurrence of the event at the end of the study
How do we define the population?
The population (parameter) denotes either people, animate/inanimate objects, or cases that have been clearly identified by the researcher before the start of a study
Often the population is not clearly defined
There are different types of populations:
Target population: often the theoretical population, includes the entire list to which researchers are interested in generalising the conclusions.
Accessible population: a subset of the target population in which researchers can apply their conclusions.
How do we define the outcome?
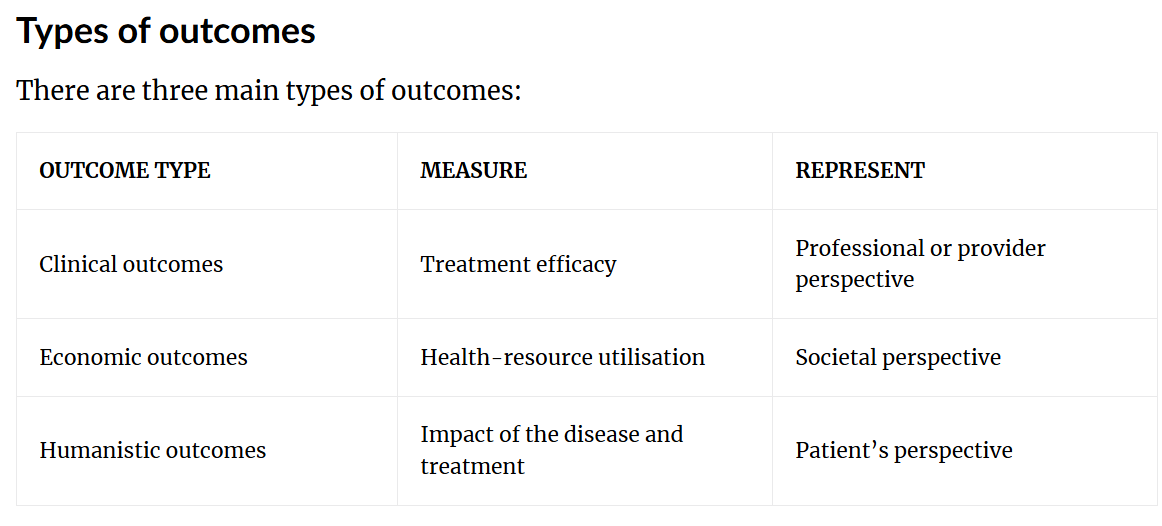
Selection of an outcome measure involves the consideration of many stakeholders including the patient, provider, payer, industry, regulatory, academic and society. It also takes into account the level of funding and the scope of the study
Conversely, the selection of an outcome measure will shape the way the data source is collected, the sample size, the frequency and length of follow-up assessments, etc.
Key considerations
reliability, validity, and variability of that outcome measure
properties of the outcome measures – minimise measurement biases
ability of the outcome measure to detect changes in an individual over time
participant/patient responsiveness
What is the study of Epidemiology?
Epi (upon) + demi (people) + ology (study)
It is the study of the distribution and determinants of health and disease in populations, and the application of this study to control of health problems
Not for individuals, for populations
What is the focus of Critical Issues in Epidemiology?
The concept of causation is very important here
There is usually not one single cause for any disease
CAUSATION - SUFFICIENT AND NECESSARY
A risk factor is sufficient, if the presence of this factor alone is enough to result in the disease
Risk factor happens → the effect MUST happen
For A to happen bacteria B is enough → sufficient
For A to happen B is needed, but you also NEED to have weakened immune system, genetical disadvantage etc. → not sufficient
A risk factor is necessary if the disease is never present when the factor is not present
Can someone get __ without the risk factor? Yes → not necessary
Mycobacterium tuberculosis is necessary for tuberculosis - you cannot get TB without this bacterium being present
High blood pressure is a risk factor for stroke, but it's not necessary - people have strokes without ever having high blood pressure

What are Risk Factors?
Few diseases have a single cause, therefore we tend to talk about ‘risk factors’
Pre-disposing: age, sex
Enabling (disabling): low income, poor nutrition
Precipitating: exposure to a disease agent
Reinforcing: repeated exposure
CAUSATION - ESTABLISHING EVIDENCE - Bradford Hill Criteria
If there is an association between a possible cause and effect, we they need to look at whether is could be due to limitations such as bias, confounding, chance, or if the relationship is causal
Strength means: How strong (large) the observed association is — typically measured by the relative risk (RR), odds ratio (OR), or risk difference
A strong association (e.g., RR = 10) is less likely to be explained by bias or confounding than a weak association (e.g., RR = 1.2)
Consistency = consistent findings in HUMAN studies
Plausibility - in the lab or animal studies a good hint here

What are the Public Health Domains and Indicators?
Injury (8% - same as Aus 2018/19)
Road accidents, drowning
Communicable diseases, maternal & perinatal conditions (18%)
Spanish flu, viruses/bacteria that can spread
Non-communicable diseases (74%)
Cardiovascular disease, cancer, diabetes, chronic respiratory disease, neurological condition
*Numbers are from the 2019 global data

Injuries?
Highly preventable (e.g. road safety, drowning)
Need to look at upstream solutions
Are the principle cause of death in almost half of the people under 45 years of age
About 8% of the population dies from injuries every year
Communicable diseases?

How do we tackle these challenges?
Making healthy choice the easy choice (taking stairs over lift)
Clear Health Promotion Campaigns (Dumb ways to die game)
Prevention and surveillance (sanitising hands)
How does Biostatistics and Epidemiology go hand in hand?
For a good data analysis, you need good data
Epidemiologists involved in study design & data collection
Risk Calc
Relative risk → Higher risk/Lower risk or intervention/control group or Exposed/unexposed
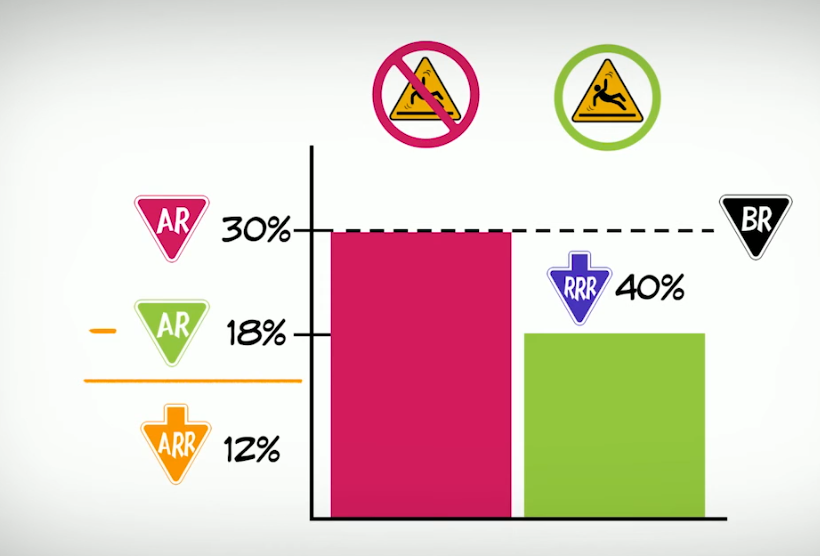
Relative risk reduction = 100% - RR calc%
If the rate ratio is 1, it suggests no difference in risk
A rate ratio > 1 → an increased risk of that outcome in the exposed group
A rate ratio < 1 → a reduced risk in the exposed group
Absolute Risk → % (also the event rate)
Absolute risk reduction is calculated by subtracting the % of the group exposed - not exposed
E.g. 30% baseline - 18% with intervention = 12% ARR → tells us the impact

What is the correct classification of data so important?
Because it determines the types of graphs that need to be used, the type of summary statistics as well as the statistical analysis needed
How to categorise Data
Categorical
Nominal (order of categories doesn’t matter) e.g. Blood group (A, B, O, AB) e.g. Diabetic (Yes / No) Also known as “binary”
Ordinal (order of categories does matter) e.g. BMI (underweight, normal, overweight, obese) e.g. Pain severity (None, Mild, Moderate, Severe)
Numerical
Discrete (counts) e.g. Number of hospital admissions
Continuous (measurements) e.g. Weight, Height, BMI, blood pressure, cholesterol, etc

Notation
Capital letters → Population, lower case letter → refers to sample
N refers to population size, n refers to sample size
Greek Letters → population attributes, normal letters → sample attributes
μ refers to a population mean; and x, to a sample mean
Big picture or Biostatistics
Note population, develop topic
Data collection (via sample)
Data Analysis
Making an inference with the data collect from the sample onto the wider population
*The two basic divisions of statistics are inferential and descriptive
What is the aim of descriptive biostats
Aim
Identify health objectives i.e. National Health Priority Areas
To assess the health status of a population i.e. Millennium Development Goals
Allows allocation of resources efficiently by targeting populations
What is the aim of Descriptive Epidemiology
Aim
Information about disease patterns – characteristics of persons, place, time and using descriptive statistics
Using measures to define a very specific about the population, and within that population there may be some disease which we can further define
To answer the question, what is the health situation?
How do we look at Prevention as an Approach in healthcare?
The first stage of epidemiologic investigation. It focuses on describing disease distribution by characteristics relating to time, place, and person
Who?
What?
Where?
When?
It is called Descriptive Epidemiology
We use this when we need to describe a chronic condition and define it in any population
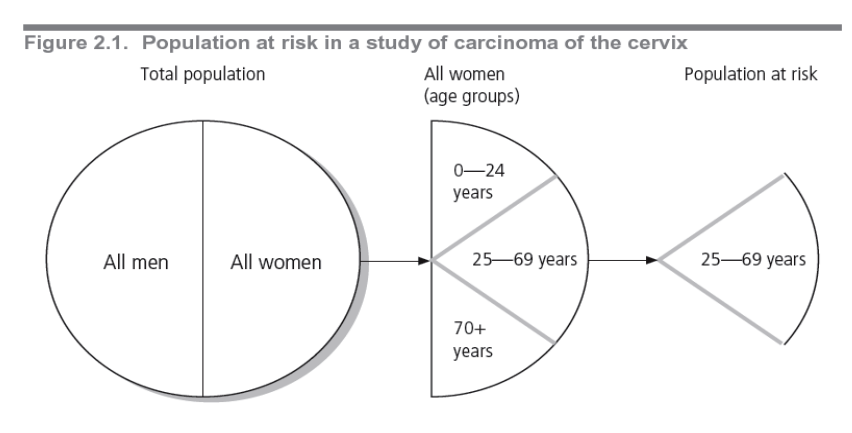
Population at risk
Group of people we are interested in studying in our research
Should only include people who are potentially susceptible to the disease being studied (e.g. Not all women, only women 25-69 as they are at risk)
Can be defined by demographic (age, gender, socioeconomic status), geographic or environmental factors
E.g. Occupational injuries = workforce
What is Mortality
Definition: Death or state being subject to death
How we use it:
It is calculated by dividing the number of deaths during the period by the total population. This can be expressed either as total mortality or cause-specific mortality.
Mortality rate = incidence rate of fatal cases/ total population at risk
Common measure
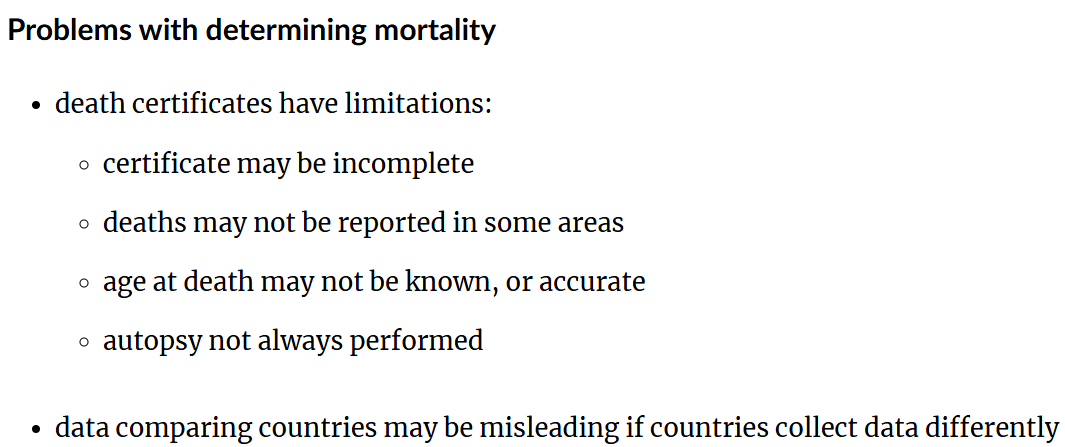
Uninformative for some diseases
E.g. osteoarthritis or psoriasis
These are chronic diseases that you won’t really die from directly
Does not mirror underlying incidence of disease
What happens if a more effective treatment is introduced (we wouldn’t know if its effective since we only look at the end point - death)
Lag behind changes in incidence
Crude
Not always complete

CRUDE MORTALITY RATE (CMR)
Crude death rate = number of deaths / number of persons at risk of dying
Calculate the crude mortality rate (per 100,000) in Australia in 2005 from drowning, using the following information
Drowning deaths: 232
Mid-year population: 20,394,791
Crude death = drowning deaths/ mid-year population = 232/ 20,394,791 = 0.0000114 = 1.14 deaths per 100,000
…out of 100,000 to make sure the data is meaningful

AGE-SPECIFIC MORTALITY RATE
Age-specific death rate – death rate for specific group of population
Calculate the age-specific mortality rate (per 100,000) in Australia in 2005 from drowning, using the following information
Age group 0-4 years: 23 deaths
Mid-year population: 1,285,545 (for that age group)
Age-specific mortality rate = number of drowning deaths in age group/people in age group = 23/1,285,545 = 0.0000179 = 1.79 per 100,000 people

What is Life Expectancy
The average number of years an individual of given age is expected to live if current mortality rates continue
What is Morbidity?
Definition: Any departure, subjective or objective, from a state of physiological or psychological well-being (e.g. headache, back-pain, tooth ache)
Death rates are useful for high case-fatality. Not so useful for low case-fatality chronic conditions. Thus are NOT used here.
E.g. Mental illness, rheumatoid arthritis
Morbidity (burden of disease measure) is more useful for chronic conditions with low case fatality
Looks at impairment, disability and handicap
In terms of morbidity, mental health issues are some of the most important causes of morbidity in the community
What is a Disability?
Definition: Any temporary or permanent reduction of a person’s capacity to function (e.g. broken a leg, stayed in bed)
What are some common measures of Morbidity and/or disability
Incidence
Prevalence
Hospital discharge
Number of office visits/consultations
Bed disability days
Work loss days
Restricted activity days
CASE STUDY: Lead Poisoning
100% preventable
There are NO safe levels
Exposures: Occupational, paint, lead gasoline, polluted soil
This is an example of Morbidity

What is Incidence?
New cases of a disease or event or death
Frequency of development of a new case or occurrence of disease in a population over time
Number of people with the disease/ no. of people who are at RISK OF THE DISEASE (can’t be just the population, it needs to be people are are more likely to have the disease, aka you can’t include men in the denominator for breast cancer)
Express this as either:
Rate (Incidence rate)
Proportion (Cumulative Incidence)

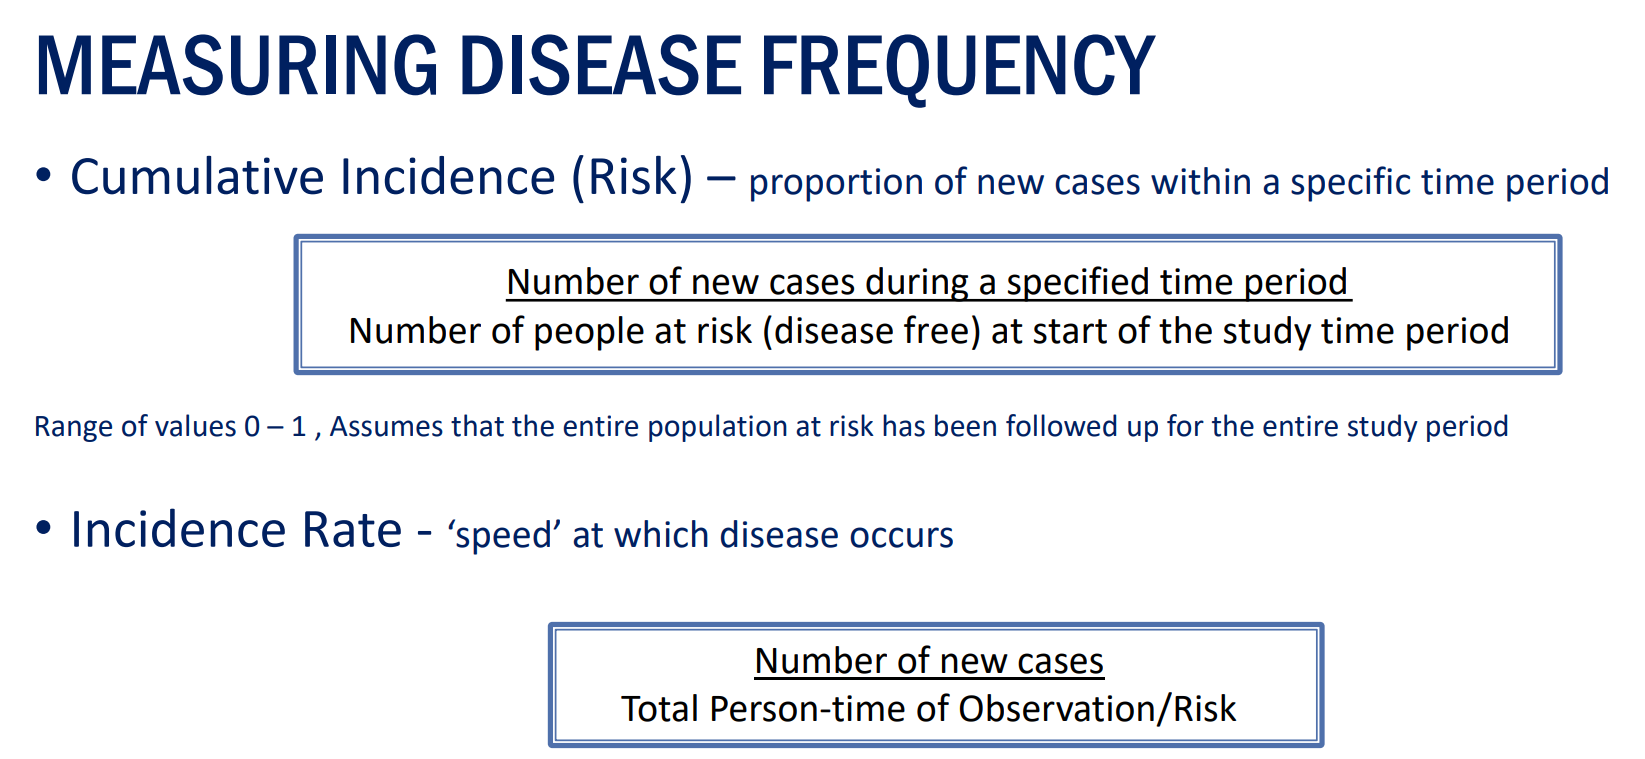
What is the Cumulative Incidence?
Definition: Proportion of a population at risk of getting a disease that become diseased over a period of time
You have a clearly defined population at risk
Everyone is followed for the entire period
You want to know the proportion of people who develop the disease over that period
Since this is a proportion, results are in the range of 0-1
Proportion of a population at risk of getting a disease/event that become diseased over a period of time
4,000 children are observed for 2 years. Over the course of 2 years 1600 children get influenza
Cumulative incidence= 1600/4000=0.4 or 40% over a 2 year period


What is the Incidence Rate?
The number of new cases of a disease divided by the person-time that the population at risk is observed - ‘speed’ at which disease occurs
Range of values 0-infinity
Person-time = true rate
Estimate of the actual time-at-risk in years of all persons that contribute to the study (the number of years a person was in the study)
Example: 4,000 children are observed for 2 years contributing a total of 7,892 person-years. Over the course of a year 1600 children get influenza
Incidence Rate = 1600/7892 = 0.203 cases per person-years = 20.3 cases per 100 person-years =203 cases per 1000 person-years

Person - Time
Is the actual time at risk that all participants contribute to a study
For example all these people have the same person-time:
1 person followed for a 1 year without disease
2 people of 6 months without disease
6 people followed for 2 months without disease
→ It’s not simply the duration of the study itself — it’s the sum of all individual observation periods during which participants were susceptible but not yet diseased (so add up all the healthy periods). So, if someone develops the disease halfway through the study, their contribution to person‑time stops at that point (so if someone gets sick after 6 months, they only contribute 0.5 person-years)
Why…
Instead of counting the actual number of people at risk we count the length of time they were at risk
More accurate measure of how quickly the disease is occurring as we can identify when risk status changes for each participant
Plus more flexibility on how we can interpret the results


What is Prevalence?
Existing cases
Frequency of an existing condition/disease at one point in time during a given period
Affected persons / persons in the population (unlike incidence they do not have to be at risk)
Factors that affect prevalence:
Disease occurrence (e.g. asthma)
Duration of illness
Severity of illness (if people die = ↓ prevalence)
Number of new cases
Types of prevalence
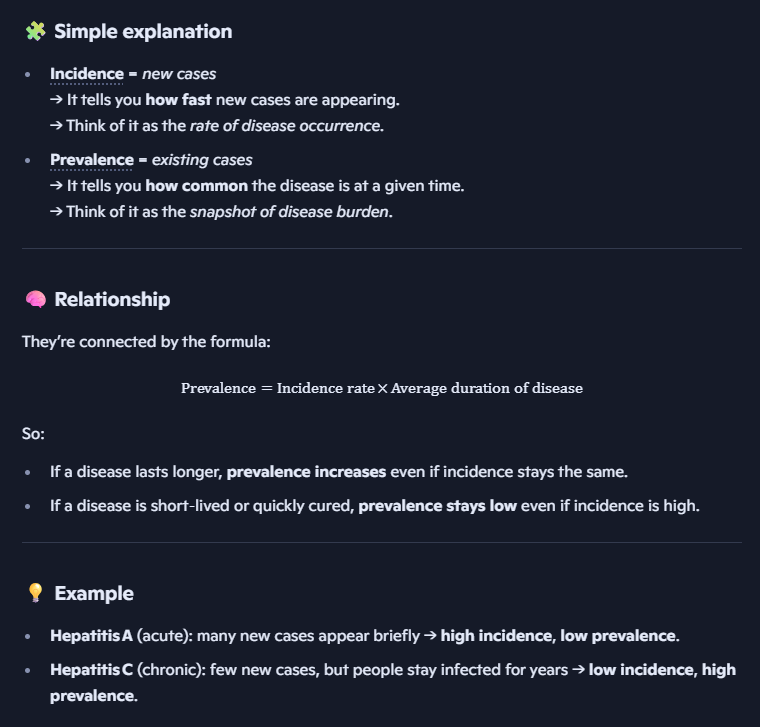
Prevalence is dependent on both the incidence and duration of disease. The specified time determines the prevalence type:
Point prevalence: Prevalence literally at one point in time (e.g. right now)
Period prevalence: Prevalence measured over a (short) period of time (e.g. over the last year)

What is the relationship between Prevalence and Incidence
If two diseases have the same incidence, but one lasts 3 times longer… at any point in time you are more likely to find people suffering from the long-lasting disease
Incidence: a count of new cases of the outcome (e.g. disease) - measures RISK
Prevalence: a count of both new and existing cases of the outcome (e.g. death) - measures burden
Prevalence = Incidence rate x average duration of disease (determined by death/cure rate)
If the death/cure rate go down → the duration will be prolonged → prevalence will go up (this could mean that there is better care here, rather than quick death)
Only true if: Stationary population AND Prevalence is low
Example: Hepatitis A versus Hepatitis C in the U.S (infectious liver disease)
Hepatitis A (acute): vaccine preventable, good hygiene and sanitation → prevalence low, incidence high
Hepatitis C (chronic): treated with medication, no vaccine, harm reduction strategies: needle exchange programs → prevalence high, incidence low

How should we make two-by-two tables to measure association b/w the outcome and exposure
Of the 250 patients treated by Drug A, 30 died; of the 200 patients treated by Drug B, 75 died

How to measure Morbidity?
More comprehensive measure of disease impact than mortality
Potential Years of Life lost (PYLL)
Quality-Adjusted Life Years (QALY’s)
Disability-Adjusted Life Years (DALY’s)
Years of Life Lost (YLL)
Years Lost to Disability (YLD)
POTENTIAL YEARS OF LIFE LOST (PYLL)
Measure of health expectancy or Number of years of potential life they lost if they die before a certain age (Most reports use death before 75 years premature death)
This indicator gives more importance to the causes of death that occurred at younger ages than those occurred at older ages.

QUALITY-ADJUSTED LIFE YEARS (QALY’S)
QALY = measure of health outcomes or benefit of health outcomes
It is the product of duration of life and a measurement of quality of life
Weights each year of life by the perceived quality of that life from a value of 1 for perfect down to 0
A QALY takes into account how a treatment affects a patient’s:
Quantity of life (how long you live for)
Quality of life (the quality of your remaining years of life
Example, imagine a person aged 55 years who lives for 10 years after a stroke and dies at age 65

DISABILITY ADJUSTED LIFE YEARS (DALY)
Health gap indicator are increasingly used for estimate of burden of diseases so that we can target interventions
Highlight the enormous burden of ill-health due to some common but non fatal conditions that don’t appear on our mortality rate indicators

What are “determinant of health” and “Health related states and event” also called?
“Determinants” of health also called:
Exposure
Treatment
X (as in X and Y in a statistical model)
“Health related states and events” they are also called:
Outcome
Disease (even if its not a disease like substance abuse)
Y (as in X and Y in a statistical model)
These terms may seem dichotomous or imply yes/no answer but they include all health outcomes (continuous, categorical, binary measures)
What are Covariates?
Other variables that have influence on the relation between an exposure and outcome These include confounders (they influence the causation relationship between an exposure and disease)
What are the two types of Epidemiology?
Descriptive Epidemiology: Hypothesis generation
Person – Who get’s the disease?
Place – Where? – geography or location
Time - When did it happen? — “Temporal”, range from hours to decades
Analytical Epidemiology: Hypothesis testing
Study design
Methods (prevalence, incidence, statistics, sample etc.)
What is a hypothesis?
A hypothesis generally takes the form: exposure X is associated with an increased or decreased risk of outcome Y
E.g. Exposure to wearing a helmet is associated with a decreased risk of dying from a head trauma in a motorcycle accidence
What are some good qualities an exposure variable have to make it worthwhile to pursue?
Have an impact on health
Be measurable
Differentiate populations
Generate testable hypotheses
Help to prevent or control disease
Financially, time, location etc. viable
What qualities should a disease have to make it worthwhile to investigate?
The disease is important in terms of:
The number of individuals it affects
The types of populations it affects
Its causal pathway or risk characteristics
What are the sources of epidemiological hypothesis?
Individual cases
Case series
Descriptive epidemiology finding
Data dredging or mining
Lab/animal studies
Analogies to other exposure outcome relationships
Common sense
Luck or chance
Other epidemiologists & publications
Where do you find a epidemiological hypothesis?
Read the literature
Examine descriptive epidemiology data
Listen to patients and families
Listen to clinicians
Read newspaper/watch tv
What are some issues to consider when making/finding hypothesis
Etiology (cause) of chronic disease is often difficult to determine (due to working with large populations usually)
Causes may differ by individual
Many exposures cause more than one outcome
Outcomes may be due to a multiple exposures or continual exposure over time
Does Epidemiology determine the cause of a disease in a given individual?
Epidemiology does not determine the cause of a disease in a given individual
Instead, it determines the relationship or association between a given exposure and frequency of disease in populations
We infer causation based upon the association and several other factors
How do we measure exposure?
Questionnaire
Self administered or asked by researcher
Biological
Lab tests — Blood/urine recent, hair longer term for drug use
Radiological – x-rays, echo
Physical examination – height, weight
Evaluation of previous medical records
Sampling of environmental factors
Biomarkers, genetic markers
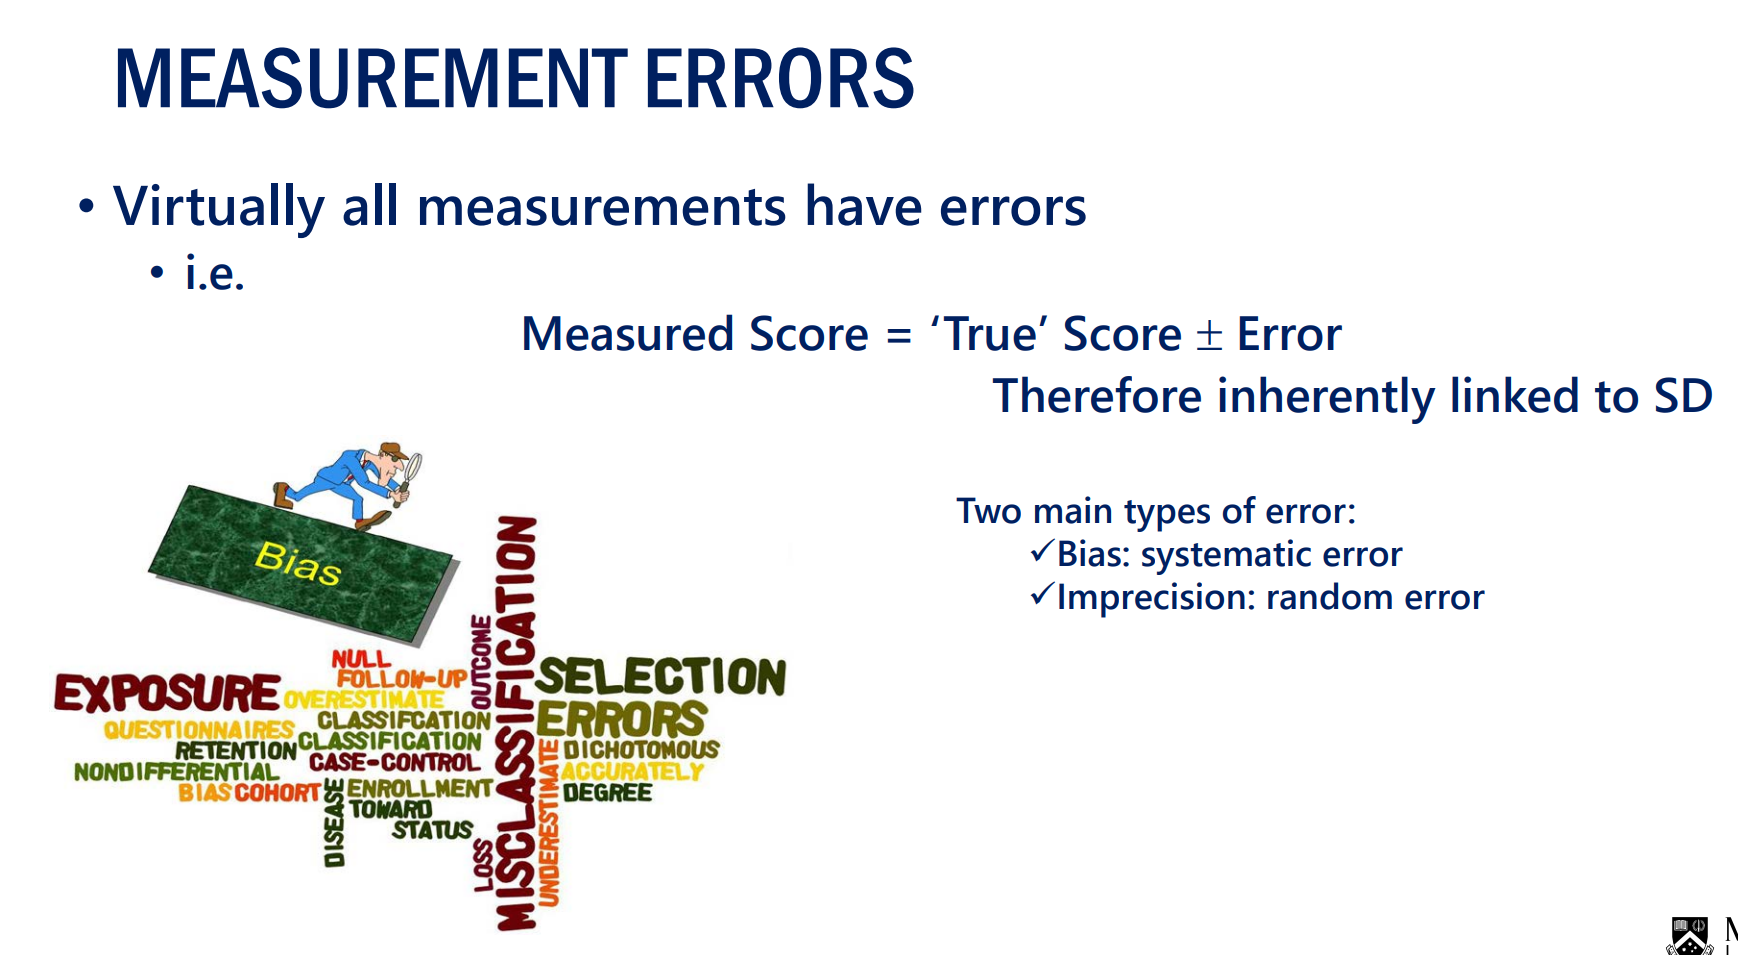
Virtually all measurements have errors
What is Bias?
Systematic error or deviation from the truth in results or inferences
Bias is the difference between results and population value due to incorrect measurements being taken or measurements being taken on a non-representative sample
Repeating the study multiple times would reach the wrong answer on average
Used to help judge the quality of evidence - more biases we eliminate the higher quality the evidence is
(e.g. Natural recovery is a source of bias)
What are the types of bias?
Selection bias
Ascertainment bias
Detection bias
Recall bias
Measurement bias
Publication bias

What is Selection Bias?
Selection bias occurs when the study cohort is not representative of the population as a result of sampling techniques
This means an appropriate spectrum of patients were not included in the study
Randomised controlled studies will be susceptible to selection bias if the randomisation process is inadequate
In particular inadequate allocation concealment is an important source of bias
How to minimise Selection Bias?
Random allocation removes the potential for bias in the assignment of patients to control and intervention groups
Investigators recruiting participants should remain unaware of the next assignment in the sequence until the decision about eligibility has been finalised
This should be administered by someone who is not responsible for recruiting subjects
The clinician must phone a central trial office once the patient has given informed consent to be randomised into the trial
The central trial office could use a computer generated randomisation as each patient is randomised so there is no prospective list
The trial office records the randomisation; in a double blind trial as Tablet A or Tablet B etc and the code for placebo versus active drug is held concealed until an analysis of outcomes is performed. If the intervention is a procedure versus observation, randomisation ends with random assignment to treatment or observation
What is Performance Bias?
Performance bias occurs during the implementation of study interventions
Performance bias occurs when participants or researchers behave differently across groups because they know which group is receiving the intervention
Performance bias may influence the results of a study if there are systematic differences in the care provided to the comparison groups other than the intervention being investigated
How to reduce Performance Bias?
Blinding is essential within a study design to ensure participants are unaware of particular elements (usually intervention) of that study
Blinding is particularly important for research with subjective outcome measures such as pain
Blinding can occur at multiple levels such as:
Single: A single party is blinded to treatment allocation (e.g. participant or researcher)
Double: Two parties are blinded to treatment allocation (e.g. participant and researcher)
Double blinding protects against placebo effects
Triple: Three parties are blinded to treatment allocation (e.g. participant, researcher and staff evaluating the response to treatment)
To establish the level of blinding and who has been blinded in a study you must read the methods thoroughly.
*The researcher may be ‘blinded’ in that they don’t know who is in the control or experimental group, this prevents subtle differences in behaviour, tone, or expectations that could influence outcomes. OR the researcher analysing results only sees coded data (e.g., Group A vs. Group B) until after analysis OR standardized procedures and instruments are used so the researcher’s expectations can’t bias data collection
What is Detection Bias?
If the outcome assessment differs systematically between comparison groups, detection bias may occur
Occurs when the person assessing results knows which treatment each participant received, and that knowledge influences how they record or interpret outcomes
Reduce bias by: Blinding (or masking) of outcome assessors may reduce the risk that knowledge of which intervention was received, rather than the intervention itself, affects outcome measurement
Meaning the people measuring results don’t know who got which treatment. This is especially crucial for subjective outcomes like pain or mood, where personal judgment can easily skew results
What is Measurement Bias?
Measurement bias is a systematic error in the measurement of information on the exposure or outcome
Measurement bias (also called information bias) happens when the way data is measured, recorded, or classified is systematically wrong
It is also known as information bias and observation bias
It is part of a broad category which includes recall bias and observer bias (a bias that occurs when the researcher is aware of the disease or exposure status of participants)
Measurement bias most frequently occurs when key information is either measured, collected, or interpreted incorrectly
What is Misclassification? And what are the 2 types?
Misclassification can also be as a result of incomplete medical records, recording errors, misinterpretation of records, errors in the questionnaire including recall bias by the participant
There are 2 types of misclassification:
Non-differential misclassification
Information is incorrect, but the same across the two groups. (e.g. In case-control studies, this is when the exposure is incorrect for both cases and controls)
This results in the 2 groups being more alike and underestimates the strength of association between exposure and disease
Differential misclassification
Information errors differ between the two groups (i.e. The bias differs between exposed and unexposed)
This results in either a decrease or increase in the perceived association between exposure and outcome
How to minimise Measurement Bias?
Standardised research protocols
Obtaining information from multiple sources
Blinding of researchers and staff to the exposure/disease status of the participant
Training of interviewers

What is Recall/Responder Bias?
Recall or responder bias is a type of measurement/information bias and is a systematic error that occurs when participants do not remember previous events or experiences accurately or they omit some detail
Recall bias can be unintentional due to poor or incomplete memory recall
The shock of an event, such as diagnosis of disease or an accident, could also distort memories as participants particularly cases tend to recall these events more clearly
Intentional recall bias call also occur - perhaps because the person is too embarrassed to admit the truth about a past event
How to minimise Recall Bias?
Recall bias can be seen in studies that have any self-reporting and it is common in the case-control studies and retrospective cohort studies
Recall bias cannot be corrected after the study has been completed
To minimise recall bias:
Define your research question carefully
Devise high-quality questionnaires
Highly trained research staff with good interview training
Choose and implement appropriate data collection methods
What is Attrition Bias?
Losses to follow up or dropouts, which are systematically different between comparison groups, may lead to attrition bias
Participant losses may occur because participants are withdrawn from the study, dropout for a number of reasons of which drug side effects are important or because of protocol violations
Often these details are poorly reported in trial results
How do we account for Attrition Bias?
Incomplete data weakens internal validity — meaning correlations may be found where there are none, or correlations may be missed entirely
This reduces external validity whereby conclusions from the study cannot be generalised to the general population
Intention to treat analysis (ITT) involves analysing all participants recruited from the randomisation process even if the study participant has not completed the study (i.e. fail to take the medicine, drop out of the study, deceased etc.)
Intention to treat analyses are done to avoid the effects of crossover and dropout, which may break the random assignment to the treatment groups in a study
Methods for dealing with missing data include baseline values or last outcome measured by participant carried forward, sensitivity analysis, mixed models, worst and best case scenarios (i.e assuming zero information all gets worse or better)

How much attrition is too much?
Less than 5% attrition leads to little bias
Greater than 20% attrition threatens validity of study
Only used as a rule of thumb, although even a small proportion of participants lost to follow up can have serious implication


What is Intention-to-treat analysis (ITT)?
Intention-to-treat (ITT) analysis analyses data for all participants according to randomized treatment assignment
It ignores failure to adhere to the intervention, it ignores protocol deviations such as changing groups, and anything else that might happen after randomization
In contrast to ITT analysis is per-protocol analysis where only data for participants who complete the study according to plan are analysed
Per protocol analysis may also be referred to as efficacy, explanatory analysis, or analysis by treatment administered analysis
What are the sources of bias?
Inappropriate influence of funders
Inappropriate co-intervention
Contamination of results
Selective reporting of sub groups
Baseline imbalance in important factors
What is a confounding variable?
Definition: Situation in which a non-casual association between a given association is observed due to the influence of a third variable
A bias that influences the 'cause and effect' outcome
Occurs when the relationship or outcome of interest is affected by a third factor
Influences the outcome and response variable
You can have multiple confounding variables in a study
A confounder can lead to inaccurate findings by masking the true effect of a primary risk factor on an outcome. Hence, confounders must be identified and acted on before the start of a study!
Coffee drinkers are more likely to get heart disease than non-coffee drinkers
Conclusion: Coffee causes heart disease?
Is there another explanation?
Could the association between drinking coffee and heart disease be confounded?

What are the type of confounding?
Positive confounding: The confounder makes the observed effect look stronger than it really is — biasing results away from the null hypothesis
Example: If coffee drinkers also tend to smoke, and you study coffee’s link to heart disease, smoking might exaggerate the apparent risk
Negative confounding: The confounder makes the observed effect look weaker — biasing results toward the null hypothesis.
Example: If physically active people also eat more calories, the extra calories might hide the protective effect of exercise on weight gain
*Null hypothesis: This is the default assumption in research — that there is no real effect or difference between groups. For example, “The new drug has no effect compared to placebo.”
Why is confounding a problem?
Conclusion: Coffee causes heart disease?
The estimate of the association between the exposure (coffee) and the outcome (heart disease) includes the contribution of BOTH the exposure (coffee) AND the confounder (smoking) which is an incorrect estimate of the impact of the exposure on the outcome

What is the difference between bias and confounding?
Bias creates an association that is not true
Confounding describes an association that is true, but potentially misleading
It is possible to correct for confounding once a study has been conducted
How do we control for confounding?
Design stage
Randomisation: equal distribution of groups
Restriction (e.g. Only non-smokers, or males)
Matching: match for age, sex, social class in case-control study. (time consuming, expensive, you might also be eliminating a risk factor(?))
Analysis stage
Stratification: Two tables of exposure vs. Outcome – one for each level of confounder
Statistical modelling: can adjust for multiple things
E.g. Late antenatal care by aboriginal infant + 9 risk factors
What is Reliability? And what are the 2 types?
Reliability – Tools that measure a given variable accurately & consistently every time
For example, a medical thermometer is a reliable tool that would measure the correct temperature each time it is used (as long as it is correctly calibrated)

What is Validity?
Validity – Legitimacy of the research & its conclusions = Measuring what it is suppose to measure
E.g. Failing construct validity and physics!
(internal, external, construct validity)
What are the types of Validity?
Internal Validity
Are results correct for the group being studied?
That your results have no confounds
External Validity
Are your results are generalisable?
Can they be applied to the real-world?
Construct Validity
Does your test measure what it claims to be measuring
Depends on how we actually create the test
E.g. If you want to measure intelligence and you decide to test this using a super hard physics test, it might not have high validity since the test would depend on whether the person knows physics, has attended hard physics classes etc. thus it is not a valid measure of intelligence
Is validity and reliability alone enough
WE NEED BOTH!!!
For example, if your scale is off by 5 kgs, it reads your weight every day with an excess of 5kgs
The scale is reliable because it consistently reports the same weight every day, but it is not valid because it adds 5kgs to your true weight. It is not a valid measure of your weight

What is the Pyramid of Evidence?
Evidence-based medicine categorises different types of clinical evidence and ranks them according to the strength of their freedom from the various biases that beset medical research
Different study types represent different levels of evidence
As you move up the pyramid, the amount of bias decreases

Important terms: Case, Control, Exposure Outcome
Case: someone who has a disease or event of interest
Control: someone who does not have the disease or event of interest
Exposure: factor which changes the likelihood that a person will develop a disease
E.g., An infectious agent or a toxin, a lifestyle factor such as smoking or some feature of diet or even marital status. It could also be an inherent characteristic such as sex or ethnic origin or genetic make-up
Outcome: Often the development of a specific disease
We use different study designs to examine the relationship between an “exposure” and an “outcome”
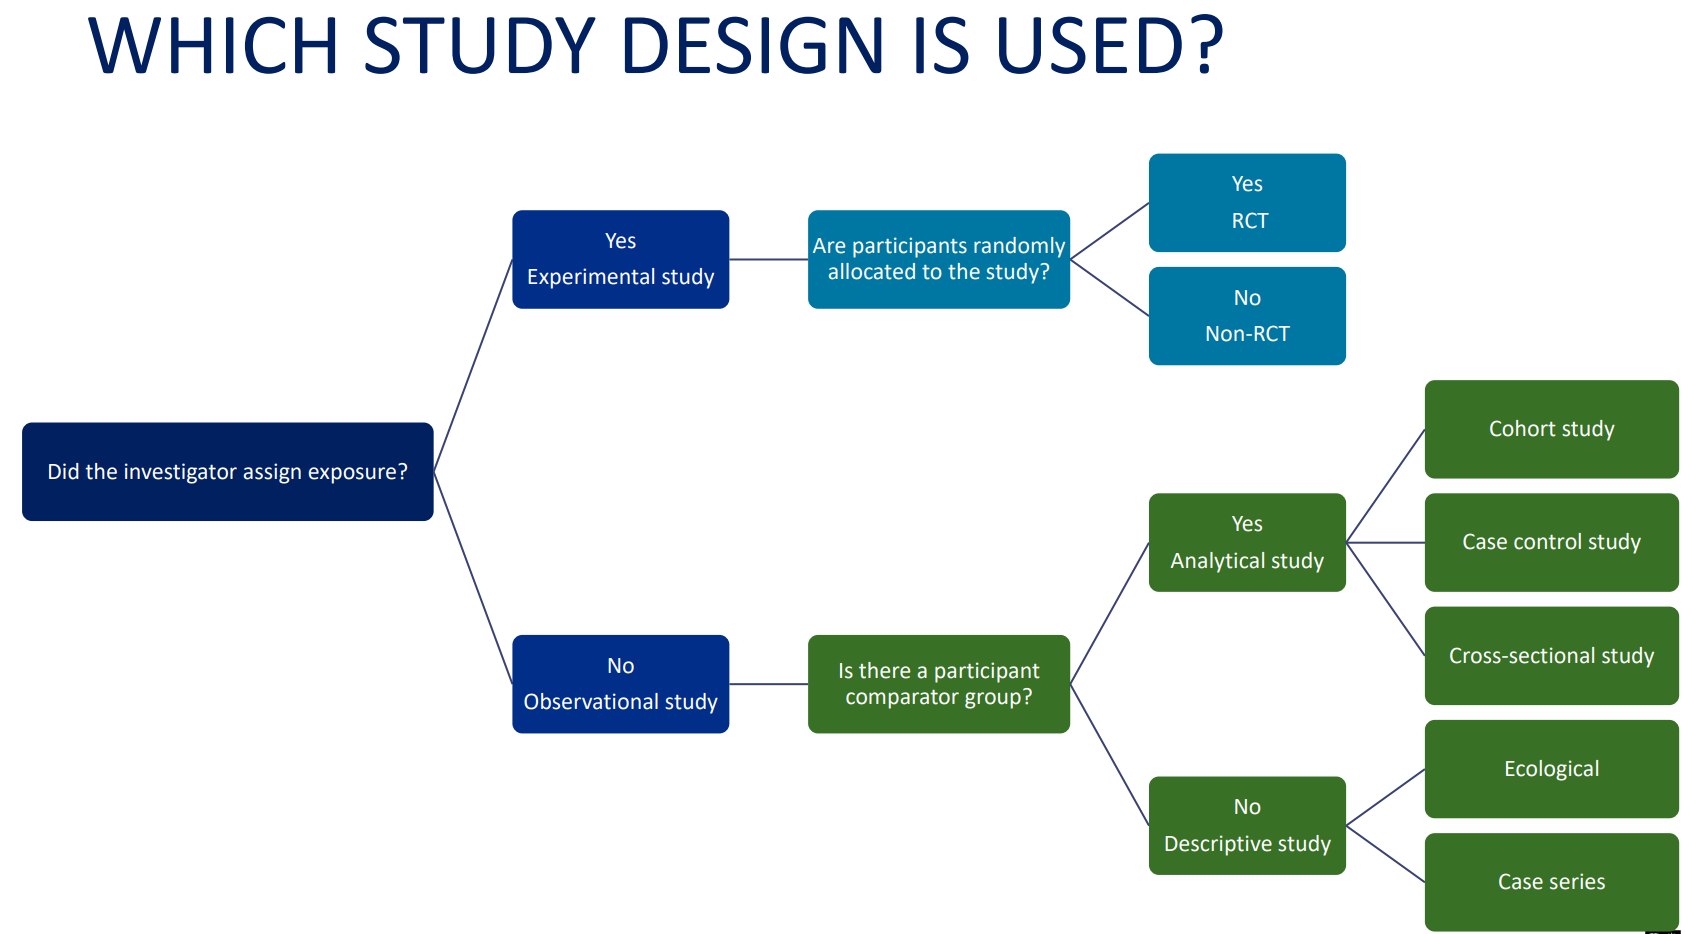
What are the types of studies under Quantitative Research

Quantitative Research: Observational Studies
In observational studies, the investigator measures or records events but does not intervene
Observational studies can answer basic Who, What, When and Where questions
Observational studies can be divided into descriptive or analytical studies
Observational studies allow nature to take its course
Analytical studies — These studies have a comparison group
Known as a control group
Descriptive studies — No comparison group
Quantitative Research: Obs: Descriptive Studies
Descriptive studies include ecological and case study designs
They describe the data but do not make any inferences about the relationships between the data (e.g. cannot establish association or causation)
No comparison group
Lowest level of evidence
Used to generate hypotheses
Can be the first observation of a rare occurrence
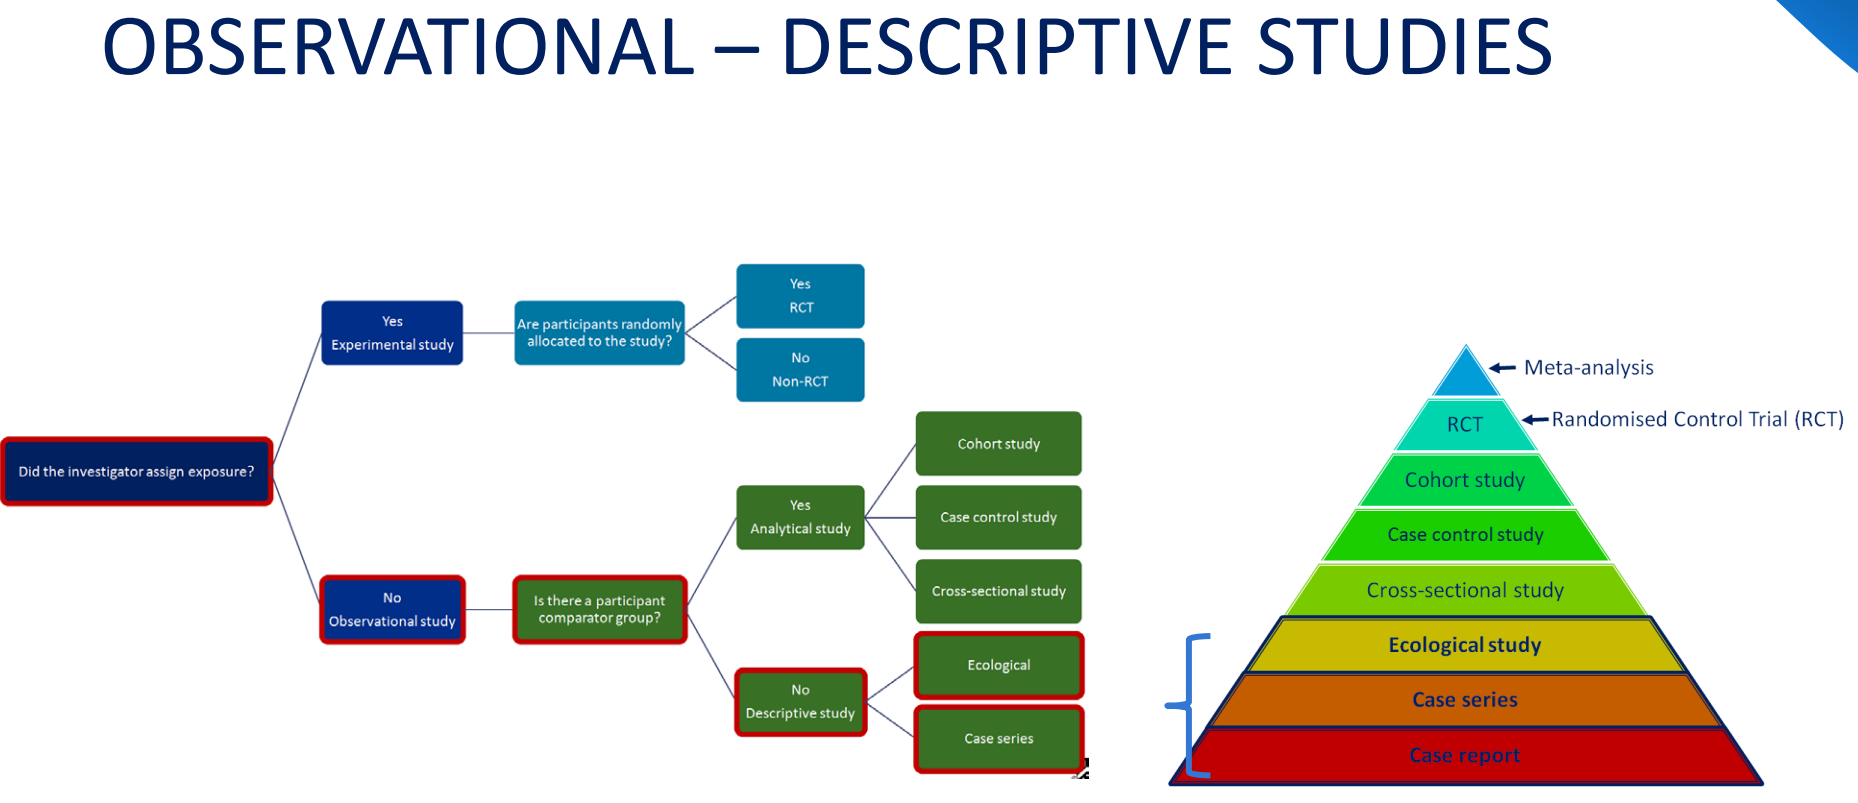
What are CASE STUDY, CASE REPORT OR CASE SERIES studies?
A case study, or case report, is one that reports observations on a single individual. Cases usually include descriptions of events for a person seeking healthcare such as:
unexpected complications
unexpected success
failure of treatment
conditions that present very rarely
A case series is an aggregate of individual case studies, usually all receiving the same intervention, with no control group. Clustering of unusual cases in a short period often heralds a new epidemic (e.g. as happened with AIDS).
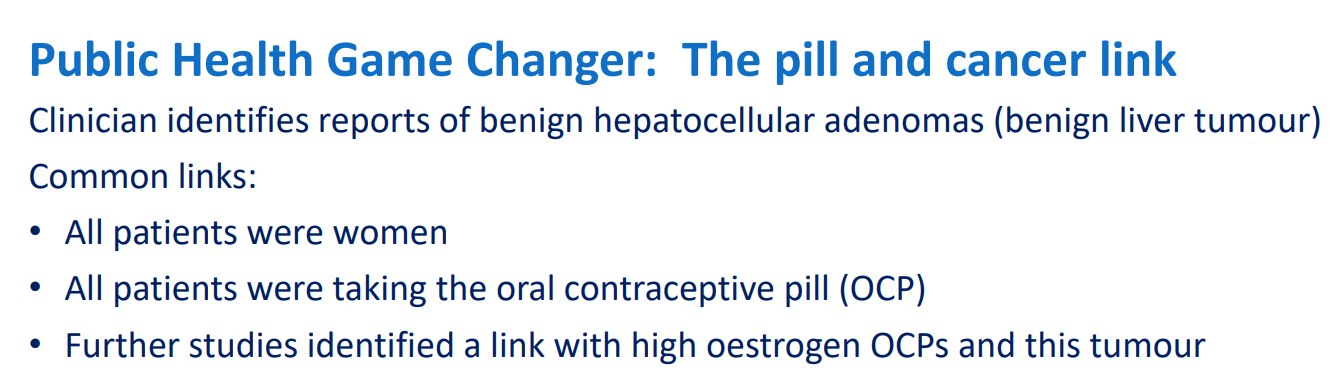
Adverse events (particularly rare events) are usually reported as case reports
There is (no comparison group) as they hypothesis generating
What are the ADV and DIS of Case study, Case report and Case series studies
Advantages
Identification of rare disease/exposures, which leads to further rigorous studies
Cheap and fast (in some cases)
Limitations
Selection bias
Confounders
What are ECOLOGICAL STUDY (CORRELATION STUDY)?
An ecological study is an observational study in which at least one variable, either exposure or the outcome, is measured at the group (not individual) level. This type of study is appropriate for the initial investigation of the causal hypothesis, although the level of strength is low.
The units of analysis are populations or groups of people rather than individuals
Compares disease frequencies between;
Different populations during the same period of time, or
Same population at different time periods
E.g. comparing the health between different populations
What are the ADV and DIS for Ecological (correlation) studies?
Advantages
Fast, easy and cheap
Ecological studies can often be done quickly because they mostly use existing, readily available data
Hypothesis generating
Compare populations in different places at the same time (be careful of ecological fallacy)
Compare the same population at different times (be careful of confounding)
Limitations
Highly susceptible to bias & confounding
Infers associations not causation (difficult to detect complicated exposure-outcome relationships)
Reduced information on confounding variable
May confuse characteristics of group for characteristics of individuals
Ecological fallacy
Ecological studies canNOT yield estimates of individuals risk of disease or death
What is Ecological Fallacy?
Remember that in ecological studies observations are made on a population level
Limitations: Ecological fallacy
The interpretation of statistical data where inferences about the nature of individuals are deduced from inference for the group to which those individuals belong
Hence any association observed at a group level does not necessarily mean that the same association exists for a single individual from that group
Example (image)
The data does support the association b/w increases sugar consumption and increases prostate caner mortality
But the data does NOT support the fact that sugar consumption causes prostate cancer mortality
You can’t look at an individual who eats sugar and say that that caused prostate cancer

What are Analytical Studies?
Analytical study designs will include data analysis that investigates the relationships or associations between independent (exposure) and dependent (outcome) variables
Cross-sectional studies, Case-control studies, Cohort studies
The investigator assembles groups of individuals to determine whether or not:
The risk of disease is different for individuals
Exposed or not exposed to a factor of interest
These studies have a comparison group


What do Cross-Sectional studies (prevalence studies) measure?
In a cross-sectional study, a defined population is observed at a single point in time or time interval and exposure and outcome are determined simultaneously
Population should be representative of the wider population for any generalisations to be made
Data can be used to assess the prevalence of acute or chronic conditions/disease in a population
Presence/absence of exposure
Disease and exposure can be assessed at the same point in time in a cross-sectional study
Because exposure and disease are assessed at the same time, cross-sectional studies may not be able to establish that exposure preceded the onset of the disease
A cross-sectional study design does not allow you to establish the direction of the relationship between these two parameters
(e.g. health surveys - asks people what disease they have at a point in time)

What are the ADV and DIS of Cross-sectional (prevalence studies)?
Advantages
Cheap & easy - disease alr developed
Exposure and outcome measured at the same time
Can investigate multiple exposures at once
Estimate prevalence of outcome(s) of interest
Useful for understanding disease aetiology and for the generation of hypotheses
Measures prevalence
Limitations
Difficult to make causal inference
Only a snapshot
The situation may provide differing results if another time-frame had been chosen
Cannot measure incidence (no new cases)
Not suitable for studying rare diseases

What are case-control (retrospective) studies?
In a case-control study, two samples are selected where the patients in one sample have the disease (cases) and the patients in another sample do not have the disease (control)
Then we look back and determine how many from each group have/had the risk factor
In a case-control study since the risk factors are investigated retrospectively, the study is often called a retrospective study
Compares people with (case) & without (control) disease
NEW (incidence) cases are best
Need a very clear, detailed case definition
Want ALL cases in the specified population group
Compares exposure between cases/controls
Controls = from the same population as cases, but no disease
Often age/gender match cases and controls
Starts with the outcome/disease/event and then investigate for the exposure
Looking backwards in time to find the possible cause or presence of exposures
Data is collected at one point in time
Very important to do matching

What are some ADV and DIS for case control (retrospective) studies?
Advantages
Good for risk identification
Since they alr have the disease you just need to look back in time to see what the risk factor could be, otherwise you would have to try a lot of different risk factors to see who develops the disease
Good for rare outcomes and ‘long diseases’
Relatively easy, fast and cheap
Can assess multiple risk factors
Investigates causes of disease – especially rare disease (e.g. Thalidomide)
Limitations
May be hard to find suitable control group
Recall bias, selection bias and measurement error
Uses retrospective data
Not good for evaluating diagnostic tests
Not good for rare exposures
(e.g. used in outbreaks (food/virus))