18. History: Postwar 2
 Call Kai
 Learn
 Practice Test
 Spaced Repetition
 Match
 Flashcards
 Knowt Play
1/31

There's no tags or description
Looks like no tags are added yet.
32 Terms
What were the three phases of post-war economic growth?
Golden Age, 1950–1973
Growth accelerated across industrialized economies.
Western European incomes and productivity converged toward US levels.
Slowdown or normalization, 1974–1990s
Growth slowed toward its historical average.
Convergence continued, but more slowly.
New global economy
The “rise of the Rest” challenged Western economic dominance.
A new phase of globalization transformed established patterns of comparative advantage.
How exceptional was Golden Age growth?
• Western European GDP grew 4.7% a year in 1950–73, against 1.2–2.1% in the earlier periods.
• 1913–50 was the slowest period: two world wars and the Depression.
• After 1973 growth fell back, close to pre-1913 pace: return to normal rather than collapse.
• The gap between GDP and per-capita GDP growth during the Golden Age reflects population growth of approximately 0.8 percentage points annually.
The post-1973 slowdown was therefore partly a return to the historical norm, rather than an unprecedented collapse.
Where was Golden Age growth strongest?
Growth accelerated in Western and peripheral Europe, but not equally everywhere:
Western European GDP grew by approximately 4.5% annually.
Peripheral Europe grew by approximately 6%.
Germany, Austria and Italy experienced especially rapid growth.
Germany underwent its Wirtschaftswunder.
Italy benefited from shifting labour from agriculture into more productive industry.
The UK grew more slowly than other Western European economies.
Greece, Spain and Portugal grew rapidly, while Ireland’s convergence began later.
Eastern Europe also accelerated after 1950, but did not catch up with Western Europe. Its centrally planned economies exhibited relatively uniform growth followed by severe stagnation after 1973.
What made the Golden Age unique?
The Golden Age combined:
Cross-country convergence: Western countries formed a “convergence club.”
Macroeconomic stability: full employment, high investment, moderate wage growth, low inflation and stable exchange rates.
Greater equality: welfare states reduced mass poverty, full employment reduced income inequality and increasing female employment reduced gender inequality.
Rapid structural change: labour moved from agriculture into higher-productivity industry and services.
Trade expansion: European economies became increasingly export-oriented.
It was not simply rapid growth; it was rapid, stable and relatively inclusive growth.
The reconstruction thesis
Reconstruction thesis: war-shattered economies automatically recover
to their historical growth path
• Wartime destruction raised the marginal productivity of capital
• The war misallocated labour and capital; reallocating them after the
war raised efficiency→ high marginal returns to rebuilding capital
Evidence: post-war growth miracles
• Countries with the largest output gaps after WWII grew fastest in the
golden age
• Defeated in WWII: Austria, Germany, Italy
• Southern periphery: Greece, Portugal, Spain
How much was there to catch up?
Catch-up = growth from reversing wartime losses of output and capacity
(Eichengreen, p. 20)
Physical destruction was smaller than the conventional reconstruction thesis suggests
• Industrial production exceeded 1938 levels by 1947 outside Germany,
and matched them by the end of 1948 including Germany
• Capital stocks were not far below pre-war levels: bombed capacity was
repaired and replaced quickly
The real gap was the growth Europe had missed
• At its normal 2.2% a year, output and capital would have been about
20% above pre-war levels by the late 1940s
• Low investment in the 1920s and 1930s made the gap larger still
• 5–10% unemployment in many war-damaged economies
Early golden-age growth was partly a 'return to normalcy', but it still
needed higher-than-usual investment
Growth theory: the Solow model
The aggregate production function
• One homogeneous output, two inputs (labour and capital) and factor-
augmenting technical change
Y = F (A, K, L) = AK^α L^1-α
• Y is output (more precisely, value added)
• K and L are capital and labour
• 0 < α < 1: production function exhibits constant returns to scale
overall, diminishing returns to each factor (curve that flattens out)
• A is technology: exogenous and factor-neutral
It distinguishes between growth through capital accumulation and growth through technical progress.
Diminishing returns: catch-up is a movement along F(k)
Catch-up means moving back along the production function \(F(k)\) toward the steady-state capital-labour ratio.
• Equal increases in capital per worker (x-axis) give ever smaller increases in output per worker (y-axis).
• When k is far below its steady state, the return to investment is high and growth is fast.
• Post-war Europe was in this position: its capital–labour ratio was below its steady-state path, so investment generated unusually high returns.
• As k approaches the steady state, returns and growth fall. This is one explanation for the end of the golden age.

Technical change: convergence is a shift of F(k)
Catch-up means reversing wartime and interwar losses:
Low capital per worker → high returns to investment → rapid capital accumulation → return toward the steady-state path.
It represents movement along the existing production function.
Convergence means closing the productivity and technological gap with the United States:
Import US technology and organizational methods → produce more with the same inputs → move the production function upward.
• Technical change shifts the whole production function up: more output from same capital per worker.
• Without technical change, diminishing returns eventually stop growth in output per worker.
• A follower can shift its F(k) towards the leader's by importing technology rather than inventing it.
• Golden-age Europe did both at once: it moved along F(k) through capital accumulation (catch-up) and shifted F(k) through technology transfer (convergence).

Growth accounting with physical and human capital
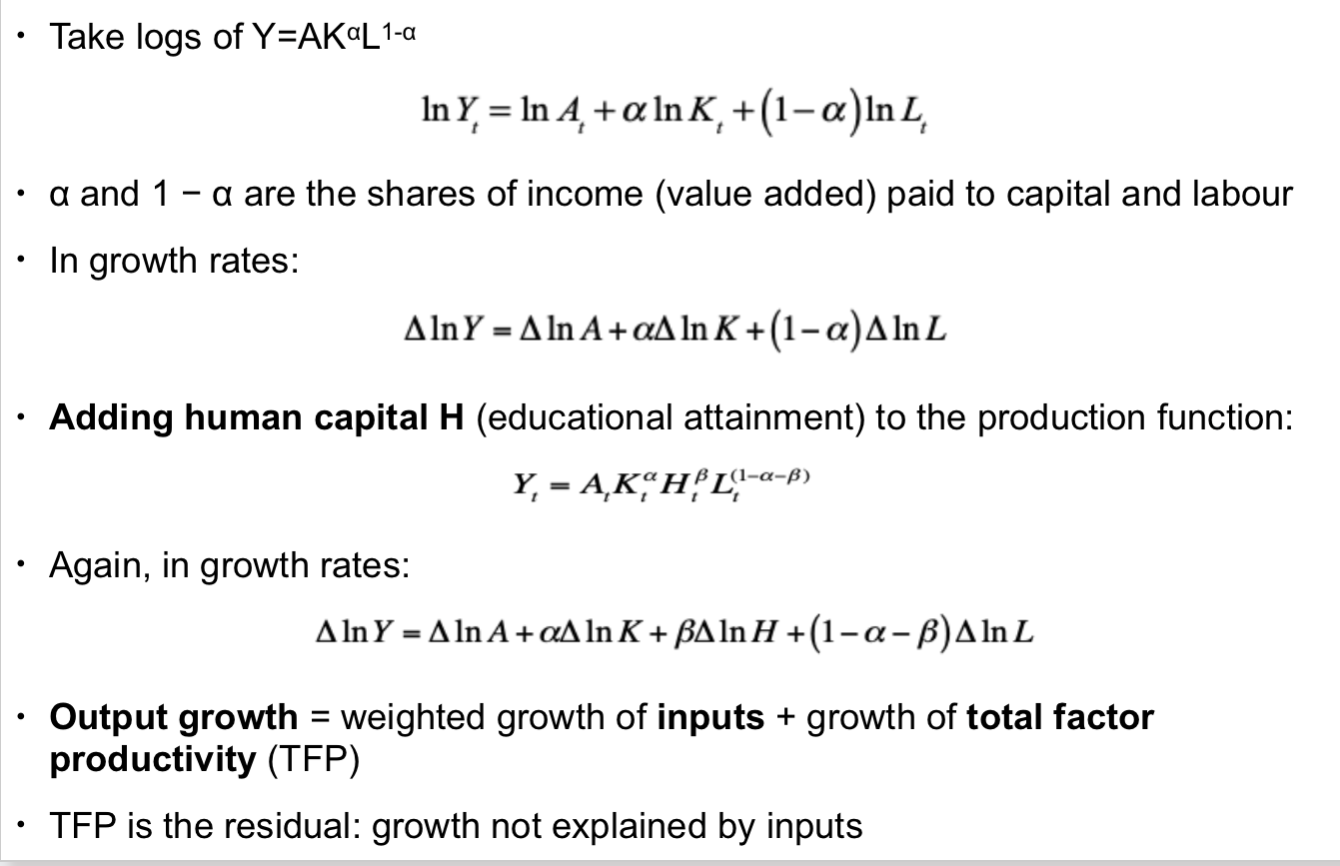
Labour productivity growth in Europe
Economists focus on productivity: output per worker
Labour productivity increases through:
Physical capital deepening: more machinery, equipment and infrastructure per worker.
Human-capital accumulation: more education, training and skills.
TFP growth: innovation, improved organization, learning and more efficient use of inputs.
This framework allows historians to identify whether growth came mainly from accumulating inputs or using them more effectively.
What does growth accounting show about European convergence?
Between 1950 and 2000:
Output per worker grew faster than the US rate of 1.90% in all 15 European countries studied, so all converged.
Capital per worker grew faster than the US rate of 1.88% everywhere, often twice as fast.
Human capital and TFP grew faster than in the US in approximately two-thirds of the countries.
Capital accumulation was therefore the most consistent source of convergence.
Britain (1. IR) had the lowest European TFP growth
Why had the United States become the technological leader?
Historically, the US productivity lead had two sources
• Early development of mass-production methods
• An early lead in technology-intensive industries
Cause 1: Economies of scale
• A large internal market with fairly homogeneous consumer demand
• The multidivisional corporation exploited scale economies: secure raw materials, cheap access to dispersed markets (Chandler)
Cause 2: Technological innovation
• Government funding for basic research
• Applied research and industrial R&D funded by large firms
Cause 3: Education revolution
• US enrolment in post-primary education was the highest in the world for most
of the 20th century
US–Europe gap in GDP per person rose from 25% in 1870 to over 40% in 1913
Why did Europe fall further behind the US between 1913 and 1950?
• Modern industrial technology favoured resource-abundant, capital-
intensive economies with large markets
• 1913–1950: Europe lacked the resources to invest in modern
machinery, infrastructure and human capital (three decades of low investment)
• Fragmentation and protectionism limited market size
• The gap moved with events
-It widened in the 1920s (assembly lines, motor vehicles, radio)
-It narrowed in the 1930s (the US Depression was exceptionally severe)
-It widened again in the 1940s (US wartime capacity and mechanisation)
• By 1950 the US productivity lead was unprecedented, which left Europe a large technological backlog to exploit
How far did Europe converge toward the United States?
In 1950, average EU-15 GDP per capita was only approximately 47% of the US level.
By 1973, it had reached approximately 65%, meaning Europe had eliminated around 40% of its initial post-war gap.
• 1913–1950: the US forged ahead in labour productivity (+2.48% a year)
• Golden age: Western Europe (4.77%) and Japan far outpaced the US
(2.77%)
• The US also grew faster in the golden age than before, so convergence
was not a story of US stagnation.
• After 1973 all three slowed, but Europe and Japan still grew faster than
the US, so convergence continued more slowly
Why do GDP per capita and GDP per hour give different pictures?
By 2003:
EU-15 GDP per capita was approximately 72% of the US level.
European GDP per hour was around 90–95% of the US level.
The difference arose because Europeans worked fewer hours.
Therefore:
GDP per capita suggests Europe’s convergence largely stalled after 1973.
GDP per hour suggests productivity convergence continued into the early 1990s.
The chosen measure affects the interpretation of European economic performance.
Through which channels was US technology transferred to Europe?
Channels of post-war technology transfer
• Rapid growth of international trade (technology embodied in goods and
machinery)
• Marshall Plan Technical Assistance Program: European managers,
officials and union leaders visited US factories
• Technical progress was more science-based, written down and spread
through journals and conferences; new communications technologies
• Multinationals (e.g. Ford) produced in several European countries
The US generally encouraged rather than restricted technological diffusion, except in sensitive areas such as nuclear weapons.
Technology transfer requires social capability: the receiving economy must possess the skills and institutions needed to use foreign knowledge.
Capacity to absorb technology: Europe's strength in technical education
• Literacy and numeracy similar to the US, with adequate numbers of
engineers and technicians
• Continental education was heavily vocational and suited to assimilating
existing techniques, not creating new ones
• The UK was the exception: general education, half Germany's share of
apprentices in engineering, and slower convergence
The US still dominated R&D, but European R&D grew faster
• The US employed about 537,000 scientists and engineers in R&D, more than
twice as many as all the European countries listed combined (about 234,000).
• R&D spending was 3.5% of GNP in the US, against 2.3% in the UK, 1.6% in
France and 1.4% in Germany.
• But European R&D spending grew much faster (e.g. France 17.9%, Germany
13.2% a year) than in the US (3.9%).
European firms also produced: Basic research in large corporate laboratories, Incremental innovations from skilled workers and shop-floor experience.
• Europe’s comparative advantage nevertheless lay mainly in absorbing existing technology, rather than innovating at the frontier.
Elastic labour supply kept wages in line with productivity
A growing supply of labour (Kindleberger, 1960s)
• Population growth: post-war resettlement and colonial repatriation
• 1947–50: nearly 1 million ethnic Germans and Poles moved from East to
West, many of them skilled
• 1950s: more German refugees, French repatriates from Algeria, Dutch from
the East Indies, southern guest workers
• Britain admitted 350,000 Irish workers (1946–59) and over 540,000 from
India, Pakistan and the West Indies (1955–68)
• Increased female labour participation
• Realocation: farm machinery cut the demand for farm labour
Why did labour supply matter?
• Flexible labour supply limited wage growth despite high productivity growth
until the late 1950s and early 1960s
• Wages did rise strongly, but not faster than productivity, so profits and
investment held up
Agricultural mechanization and farm consolidation released workers without reducing food production.
Because productivity was higher in industry than in agriculture, reallocation itself increased aggregate productivity. Denison estimated that it added as much as one percentage point to annual European growth, except in Britain, where agricultural employment was already low.
Mass-production technologies also divided production into relatively simple tasks, so the limited skills of some new workers did not prevent their employment.
If labour would have been scarce, the wages would have eaten up the money needed for investment.
Catch-up and convergence both required high investment
Both catch-up and convergence required investment:
Catch-up required rebuilding capital per worker.
Convergence required purchasing machinery embodying advanced US technology.
• Golden age: an investment boom driven by high returns to capital
• Accelerator principle: the propensity to invest depends on expected
profits, which depend on:
-Expected future demand for output
-The relative price of the complementary factor to capital, namely labour
• Role of institutions:
-Wage moderation: Generated the profits required to finance investment
-Trade openness: Increased market size generated economies of scale, allowing European economies to exploit their comparative advantages
Gross fixed non-residential investment as a share of GDP increased substantially:
• Investment rates rose throughout Western Europe after the war
• Non-residential = business and government spending on physical
assets used for production, excluding private housing
• Germany's rate rose fastest in the 1950s, in step with its growth miracle.
• Even the UK doubled its rate, but it stayed the lowest in Western Europe
How did macroeconomic stability support investment?
Investment depends on expected future demand and profits. The Golden Age provided exceptional cyclical stability:
The standard deviation of GDP growth was below 1% in Western Europe during the 1960s, compared with around 2% in the US.
No economy-wide collapse comparable with the 1930s occurred.
There was no serious recession between the early 1950s and late 1960s.
Even during the most serious slowdown, European economies still grew by approximately 0.5%.
Stable sales and demand made investment appear safer and more profitable.
This stability cannot simply be attributed to discretionary Keynesian policy:
Monetary policy was not used actively.
Fiscal policy sometimes became procyclical because of implementation lags and elections.
Automatic stabilizers were generally more successful than discretionary intervention.
The social contract: a time-consistency problem
• Growth depended on a social contract between firms and workers over how
profits are shared
• In a dynamic game, the contract is undermined by the time inconsistency of
optimal plans
-Workers will not accept wage moderation unless they are sure firms will
reinvest profits
-Firms will not reinvest profits unless they are sure unions will accept wage
moderation
-The risk was a repeat of the interwar years: higher wages, profits paid out as
dividends, low investment
• After WWII governments were strong enough to hold the social partners to their commitments
-Neocorporatism: tripartite institutions of government, management and labour
-Evidence: Strikes in 1946–50 were only a quarter of their 1919–24 level
• Result: an equilibrium of high investment, high productivity and low wages
Where did wage restraint succeed or fail?
Forms of wage restraint in post-war Europe
• Broad social pacts (Belgium, the Netherlands)
• Intervention by labour governments (Scandinavia)
• Institutionalised wage bargaining (Austria, Germany)
Failures
• Countries at full employment with militant craft unions had severe
wage pressure and industrial action (France, Italy, UK)
Making the bargain stick required three things (next slides)
• Monitoring + enforcement + coordination
Monitoring compliance
• Compliance must be monitored to be enforced
• Firms' compliance was critical: initial wage restraint financed reconstruction
• Two approaches, with many variants
-External monitoring: publicising information about non-compliers
-Internal monitoring: labour inside the firm
• Examples of internal monitoring
-Co-determination put workers on executive boards of large firms
-Germany: Mitbestimmung (1951); over 100 large firms by the late 1950s;
50% of firms in coal and steel
-Austria: co-determination in nationalised industries (about 20% of
employment)
-Netherlands: employment and investment policies in public companies
• Work councils in smaller firms
• Advisory boards with labour representatives
Enforcement: bonding firms and labour
• To make the contract work, the social partners had to be 'locked in'
• Enforcement: 'bonds' that punish reneging firms
-Austria: subsidies tied to commitments and punitive taxes on non-compliers.
Public enterprises sold inputs below market prices to firms that followed agreed
investment and dividend policies
-Germany: tax breaks on reinvested profits, but not on profits paid as dividends
-Sweden: dividends regulated, and firms could deposit up to 40% of profits in
public accounts released only with government approval
• Welfare benefits to workers made conditional on the social contract
-Netherlands: unemployment insurance and old-age pensions
-Germany: pensions indexed to living standards (1957)
-Italy: employer social-security contributions (1960s)
• A shorter working week to compensate for wage restraint
-Norway: paid holidays and limits on the working week
-The Swedish model: lifelong learning and retraining schemes
Coordinating wage bargains across sectors
• For the social contract to work, bargaining had to be coordinated across sectors
• Externality: wage restraint in one sector might affect profits and investment, and so future wages, in other sectors
• Two ways to internalise the externality
-National bargaining between 'umbrella' organisations
-Government-mediated bargaining at industry level
• Examples:
-Germany: follow-the-leader. The metal workers' union settled first and others followed its norm
-Sweden: the prototype. The LO (blue-collar unions) and SAF (employers) set a framework each year, and branch talks then adjusted it
How did European integration support export-led growth?
Trade integration widened markets and allowed firms to exploit economies of scale.
Important institutions included:
OEEC Code of Liberalization: gradual removal of import controls.
European Payments Union, 1950: credits financed temporary trade deficits and made liberalization credible.
European Coal and Steel Community, 1951: coordinated coal and steel production and enabled German industrial recovery under international supervision.
GATT: reduced the risk that European integration would become protectionist.
Bretton Woods: provided stable but adjustable exchange rates.
IMF: offered financing during balance-of-payments difficulties.
European Economic Community: further expanded intra-European markets.
The US provided Marshall Plan funding and political support, including approximately $350 million for the EPU.
Why was the ECSC economically important?
Coal and steel were essential to both industrial recovery and military power.
The ECSC:
Placed French and German heavy industry under joint supervision.
Reassured France that German industrial recovery would be peaceful.
Allowed restrictions on German industrial production to be removed.
Supported recovery because Germany was Europe’s main producer of capital goods.
Created the first genuinely supranational European institution.
Its High Authority, Assembly, Council and Court anticipated later European institutions.
How did wage moderation and exchange rates support export-led growth?
After WWII, most European currencies were stabilized at competitive or undervalued levels.
Unlike the 1920s:
Governments did not generally restore currencies at overvalued pre-war parities.
Wage and price growth remained broadly aligned with productivity.
European production costs remained low relative to US costs.
Germany benefited particularly from the 1948 stabilization and 1949 devaluation. Belgium and France were less competitive and experienced weaker export growth.
The causal chain was:
Wage moderation → competitive costs and exchange rates → export growth → larger markets and economies of scale → higher profits and investment → technology imports and productivity growth.
Why were investment-led and export-led growth “two sides of the same coin”?
Exports supported investment by:
Expanding the market for mass production.
Increasing competition and productivity.
Attracting American multinationals.
Generating foreign exchange to import advanced machinery.
Producing profits that could finance investment.
Supporting saving and the current account.
Relaxing the balance-of-payments constraint.
Investment supported exports by:
Increasing productive capacity.
Embodying modern technology in machinery.
Lowering unit production costs.
Improving international competitiveness.
Thus, neither investment-led nor export-led growth can be understood separately.
What were the results of export-led growth?
Between 1950 and 1973:
EU-15 intra-European exports grew by approximately 13.2% annually.
Total exports grew by approximately 12.2%.
Germany led the export expansion.
Britain lagged behind.
Export growth slowed considerably after 1974.
Trade integration produced mostly trade creation, rather than trade diversion, because:
European economies had similar development levels.
Internal liberalization occurred alongside GATT liberalization toward the rest of the world.
Where did the institutions come from? Olson versus path dependence
What was the impact of World War II? Two interpretations!
'Clean slate' (Olson)
• Stable democracies accumulate 'distributional coalitions’ → policymakers become captive to special interests
• Major disruptions such as dictatorship and war can destroy these coalitions. According to the clean-slate interpretation, Germany and Japan grew rapidly because defeat removed old vested interests and allowed more encompassing, publicly controlled institutions to emerge.
Rapid growth therefore followed institutional destruction.
Path dependence (Eichengreen)
• Post-war institutional reforms did not start from a blank slate – they were messy compromises shaped by pre-war history (e.g. war removed neither France's farm lobby nor Germany's unions)
• Germany: the corporatist model grew out of the 19th century
• Britain: fragmented craft unions dating back to Industrial Revolution; hard to dismantle
Post-war arrangements were historically rooted compromises. Institutional continuity, not institutional destruction, provided the foundation for recovery.
Why the institutions fitted the golden age
• Continental institutions (bank-based finance, state involvement in bargaining) were built for late industrialisation, a period of extensive growth
• They suited another period of extensive growth after 1945: catch-up through capital accumulation and convergence through imported technology
• Britain's early industrialisation needed no such institutions, so it inherited craft unions and had no need for bank-based finance → bad fit for post-war period → Britain falls behind
Roots of coordination: from Bismarck to the 1930s pacts
• 19th century: continental states actively promoted industrialisation without losing sight of social issues
-Banks such as the Crédit Foncier (state-directed finance), Bismarck's social
insurance (health, accident, pensions), and his proposed economic council
(Wirtschaftsrat) uniting industry and labour
-Catholic social teaching (later Christian Democracy) pushed for social harmony and cooperation between workers, businesses and the state
• World War I: governments brought unions and employers together to prevent
strikes
-Recognition of collective labour representation in the Treaty of Versailles; creation of the ILO
• 1920s: more social spending (Weimar Germany, Scandinavia); experiments in
planning
• 1930s: corporatist pacts in response to the Depression: State corporatism in Franco's Spain, Mussolini's Italy and Hitler's Germany: the Allies used these structures rather than dismantling them
• Post-WWII leaders built the "Golden Age" European economy along those lines
The Pay-Off: European exports grew 12–13 per cent a year in 1950–73
• EU-15 intra-European exports grew 13.2% a year in 1950–73 and total exports 12.2%
• A sharp contrast with the interwar years!
• Germany led; the UK lagged
• Export growth slowed after 1974
Why was neocorporatism particularly successful in small countries?
According to Katzenstein, small open economies were:
Highly exposed to international economic disruption.
More vulnerable to external security threats.
More socially cohesive.
More likely to develop a “we are all in the same boat” mentality.
These characteristics made compromise between government, labour and firms easier.
Sweden, Norway, Switzerland and the Netherlands developed especially coordinated arrangements. France’s divided Popular Front was less successful, helping explain its weaker post-war neocorporatism.
Why did inherited continental institutions fit the Golden Age?
Continental institutions had developed to support late nineteenth-century industrialization:
Bank-based finance mobilized large investments.
Governments coordinated economic development.
Industrial unions supported centralized bargaining.
Vocational education trained workers to operate existing technologies.
These institutions were well suited to post-war extensive growth:
Catch-up through capital accumulation.
Convergence through imported technology.
Large-scale manufacturing.
Coordinated wage restraint.
This follows Gerschenkron’s idea of institutional substitution: late industrializers created institutions that substituted for missing markets and prerequisites.
Why did Britain perform less successfully?
Britain industrialized earlier, when:
Manufacturing required less capital.
Bank-based financing was less necessary.
Government did not need to organize a “big push.”
Labour was organized through craft rather than industrial unions.
Britain therefore inherited:
Fragmented unions.
Less coordinated wage bargaining.
Less vocational education.
Weaker bank-industry relationships.
These institutions had suited early industrialization but were poorly matched to post-war catch-up based on large investment, mass production and coordinated technology transfer.
What is the complete explanation for Golden Age growth?
The causal chain was:
Wartime and interwar backlog
→ high returns to capital and scope for technological convergence
→ wage moderation and elastic labour supply
→ sustained profitability
→ high investment
→ adoption of US technology and mass-production methods
→ productivity growth and competitive exports
→ larger markets and economies of scale
→ further investment, productivity growth and rising future wages.
This process was sustained by:
Neocorporatist social contracts.
Welfare-state compensation.
Coordinated wage bargaining.
European trade integration.
Bretton Woods exchange-rate stability.
GATT and IMF support.
Historically rooted institutions.
That combination—not reconstruction alone—explains the extraordinary growth of 1950–1973.