Week 8a: Mass Bleaching in the Great Barrier Reef
 Call Kai
 Learn
 Practice Test
 Spaced Repetition
 Match
 Flashcards
 Knowt Play
1/10

There's no tags or description
Looks like no tags are added yet.
Name | Mastery | Learn | Test | Matching | Spaced | Call with Kai | Chat |
|---|
No analytics yet
Send a link to your students to track their progress
11 Terms
what is a collapse profile
represents the rate of change in a chosen indicator variable
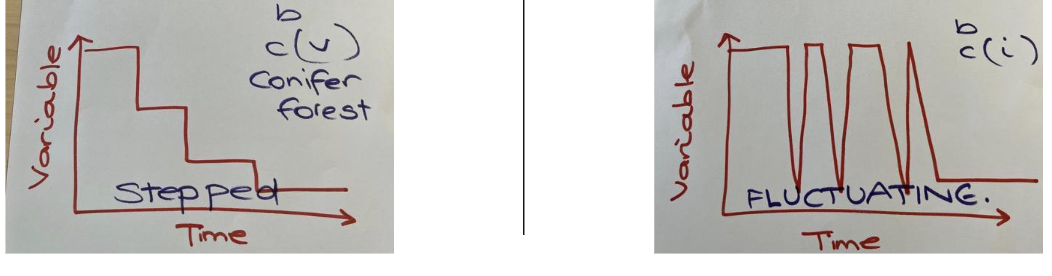
types of collapse profiles
abrupt: pulse/one off events
smooth: press pressures
stepped: consecutive events, ecosystem does not recover and eventually collapses
fluctuating: events that decrease health of ecosystem, but ecosystem recovers. ecosystem is resillient

3 main methods of ecosystem monitoring
satellite
aerial survey
underwater survey
Satellite: what does it answer, and what is its +/-?
Where did thermal stress occur?
+: Broadest spatial coverage.
-: Temperature data from satellites measured the pressure, not bleaching itself
Aerial survey: what does it answer, and what is its +/-?
Where was bleaching occurring/how widespread was visible bleaching?
+:Detects reef scale bleaching patterns, extensive spatial replication possible, broad coverage
-: limited underwater detail
Underwater in-situ survey: what does it answer, and what is its limit?
Did aerial scores reflect coral condition underwater? Able to directly observe coral condition at selected reefs and sites.
+: Provide fine-scale detail and ground-truthing aerial scores.
Why need to observe more than 1 reef?
Reef condition varies, 1 site is unrepresentative
Why are all 3 monitoring methods needed?
No single method provides scale, detail and validation simultaneously → all 3 methods are needed.
Press/pulse pressures on a global scale for coral
Press: Temperature rise, ocean acidification, salinity
Pulse: Crown of thorns starfish, floods, storms, heatwave
Press/pulse pressures on a regional scale
press: habitat loss
pulse: runoff/pollution
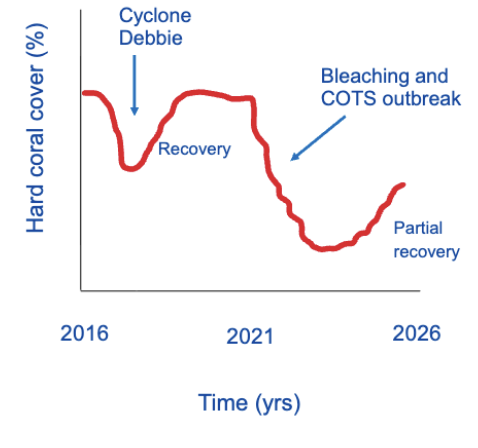
A fluctuating ecosystem trajectory (graph)
stressors of different severities can affect an ecosystem at same/different times, before recovery is complete
a short section of the graph may not represent the long term trajectory