math day 19
 Call Kai
 Learn
 Practice Test
 Spaced Repetition
 Match
 Flashcards
 Knowt Play
1/25

There's no tags or description
Looks like no tags are added yet.
26 Terms
when to know which standard error to use
Categorical Data (Proportions / Percentages): The question gives a proportion (p=0.40) and asks about a sample proportion (p^). Since this counts "yes/no" categorical responses (whether a student used marijuana or not), you use the standard error formula for proportions:
quantitative Data (Means / Averages): You only use nσ when the problem provides a population mean (μ) and standard deviation (σ) measured in continuous numerical units (like test scores, heights, or minutes).

sampling distribution of the sample proportion symbol
p̂

sampling distribution
the fraction or percentage of individuals or items in a specific sample that have a certain characteristic of interest
sample proportion vs sample mean
A sample proportion (p̂) and a sample mean (x̄) are both statistics used to estimate unknown population parameters, but they measure fundamentally different types of data
Sample Proportion (p̂) | Sample Mean (x̄) | |
|---|---|---|
Data Type | Categorical (binary, yes/no, or success/failure) | Quantitative (numerical measurements) |
What it Measures | The fraction or percentage of items in a sample that possess a specific characteristic. | The arithmetic average value of a set of numerical observations in a sample. |
symbol | p̂ | x̄ |
Population Parameter | p (population proportion) | μ (population mean) |
dif formulas as well
Sampling Distribution: Mean and SD
The mean of “the sampling distribution of the sample proportion”
will always be equal to the population proportion:
The standard deviation of “the sampling distribution of the sample
proportion” is:
It is also called standard error of p

Central Limit Theorem for Proportion
If n is sufficiently large, satisfying the condition:
“np ≥ 15 and n(1-p) ≥ 15”,
then the sampling distribution for the sample proportion is approximately normal with the mean and standard deviation
can use z score too

statistical inference
involves drawing conclusions about population parameters from analyzing the sample data.
3 main types of inferences
point estimation
interval estimation
hypothesis testing
point estimation
Estimate the unknown parameter based on a point estimator.
Format: A single number (e.g., sample mean x̄ = 13 or sample proportion p̂ = 0.6755
While simple, it does not tell you how close the estimate actually is to the true parameter because it lacks a measurement of uncertainty or error
interval estimation
Estimate the unknown parameter based on an interval estimator, typically expressed as an estimator with its margin of error.
hypothesis testing
Determine whether sample data provide sufficient evidence to support or reject a claim about a population parameter.
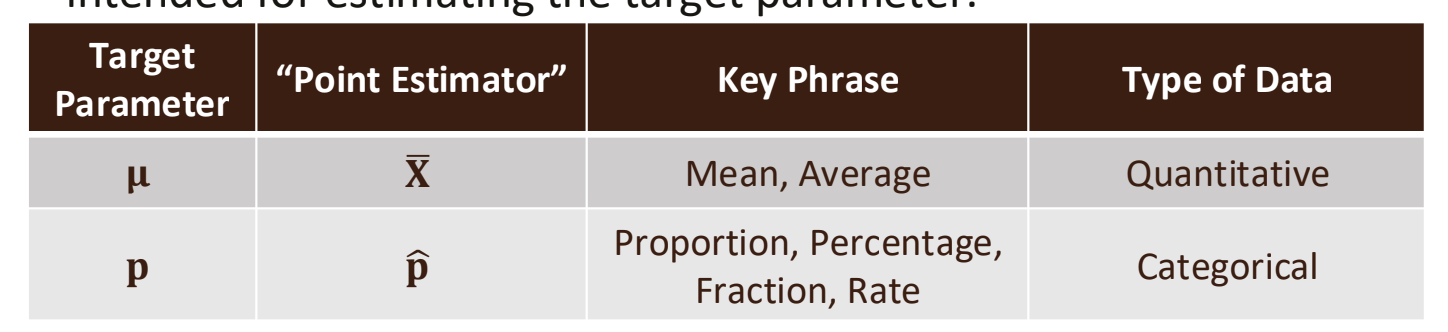
target parameter
The unknown population parameter of interest
Point estimator (estimator)
a statistic based on a random sample intended for estimating the target parameter.
Once a particular sample is observed, we obtain a specific value of the point estimator.
two types of target parameters and point estimators
Point Estimation vs. Interval Estimation
Point estimation by itself is not sufficient because it doesn’t tell us how close the estimate is likely to be to the parameter.
An interval estimation is more useful, it incorporates a margin of error which helps us to gauge the precision of the point estimation.

interval estimator
consider an interval estimator called a (1-α) confidence interval:
point estimator ± margin of error
margin of error
a statistical measurement that expresses the amount of random sampling error or potential inaccuracy in a survey, poll, or scientific estimate
Confidence Interval for Population Prop.
o The target parameter, population proportion p, is unknown.
o We use our sample proportion p̂ to make an inference on the target
parameter.
o Therefore, p̂ is the point estimator of (1-α) confidence interval for
population proportion.
confidence level
the degree of confidence we wish to have in our interval estimation.
o Conventionally, we use 0.9=90%, 0.95=95% or 0.99=99%
since (1-α):
• When α=0.1, we will have a 90% confidence interval.
• When α=0.05, we will have a 95% confidence interval.
• When α=0.01, we will have a 99% confidence interval.
Confidence Interval: Cut-Off
The cut-off is Z(α/2) is determined by the desired confidence level.
Margin of Error = Cut Off × Standard Error
Confidence Interval for P: Step One
Check the assumptions
what must be true to have confidence intervals
1. The variable must be categorical
➔ Because we are dealing with proportions.
2. Data must be obtained through randomization
➔ This implies a random sampling.
3. We MUST make sure that np ≥ 15 and n 1 − p ≥ 15
➔ This ensures that p follows a bell-shaped distribution by C.L.T.
Confidence Interval for P: Step Two
Calculate the three components
Confidence Interval for P: Step Three
Compute the confidence interval and provide interpretation:
Explain why you need stronger evidence to make the prediction when you want greater confidence.
The more confident you want to be about the results, the wider the confidence interval will be.
Higher Confidence Level —>Larger Critical Value (z^*) —> Wider Interval
Wider Interval —>Higher chance 0.50 falls inside —>Requires a stronger, larger lead to predict a winner
Standard error shows what?
It estimates how much the sample proportion from samples like this vary from sample to sample.