HLTC19 - midterm prep
 Call Kai
 Learn
 Practice Test
 Spaced Repetition
 Match
 Flashcards
 Knowt Play
1/260

There's no tags or description
Looks like no tags are added yet.
Name | Mastery | Learn | Test | Matching | Spaced | Call with Kai | Chat |
|---|
No analytics yet
Send a link to your students to track their progress
261 Terms
Chronic disease epidemiology focus
Chronic disease epidemiology asks more than:
• Who develops disease?
It also asks:
• What diseases occur?
• Who experiences greater or lesser risk?
• Where and when do patterns differ?
• Why do those differences arise?
• At what level could we intervene?
Chronic disease deaths
≥43 million deaths from noncommunicable diseases worldwide in 2021
• ~75% of non-pandemic-related deaths globally
• 18 million deaths occurred before age 70 (misconception: CD only in old populations)
• 82% of these premature deaths occurred in low- and middle- income countries
Common conditions: Chronic disease

The burden of chronic disease includes:
• Premature mortality
• Years lived with illness
• Functional limitations and disability
• Reduced quality of life
• Multimorbidity (multiple cds)
• Health care use and costs
• Impacts on families, employment, and communities
risk factors of chronic disease
behavioural risk factors lead to metabolic risk factors which lead to chronic disease
behavioural:
• Tobacco
• Diet
• Alcohol
• Physical inactivity
metabolic:
• Blood pressure
• Blood glucose
• Lipids
• Adiposity
what shapes the distribution of behavioural and metabolic risks?
Social context and time
The epidemiologic transition
• Chronic diseases weren’t always the dominant causes of death
• This transition describes long-term changes in:
• Mortality
• Life expectancy
• Fertility
• Population age structure
• And how that leads to changing causes of illness and death
As mortality ____ and populations ____, the relative importance of different diseases changes.
declines
age
Omran’s classic model
Age of Pestilence & Famine
Age of Receding Pandemics
Age of Degenerative & “Man-Made” Diseases
Age of Pestilence & Famine
High and fluctuating mortality
Low life expectancy
Infectious disease Malnutrition
Age of Receding Pandemics
Declining mortality
Increasing life expectancy
Population growth
Age of Degenerative & “Man-Made” Diseases
Longer life expectancy
Lower fertility
Chronic diseases become dominant causes of death
Stage 1: Pestilence and famine
Population Context
• High infant and child mortality
• High and fluctuating mortality
• Low average life expectancy
• Periodic famine and epidemics
Major Health Threats
• Infectious disease
• Malnutrition
• Poor sanitation
• Maternal and perinatal mortality
Disease patterns reflect living conditions
Stage 2: Receding pandemics
• Improved sanitation and clean water
• Improved nutrition and living conditions
• Better hygiene
• Public health interventions
• Scientific understanding of infectious disease

Stage 3: Chronic disease becomes increasingly prominent
As infectious-disease mortality declines:
• Cardiovascular disease
• Cancer
• Diabetes
• Chronic respiratory disease
• Other long-duration conditions
become increasingly important contributors to population morbidity and mortality.
This does not mean infectious disease disappears.
High fertility + early mortality age structure

Lower fertility + greater survival age structure
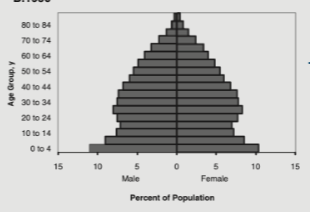
Older population age structure

Disease patterns and population structure change together.

Is the transition really that simple?
• Infectious and chronic diseases coexist
• Countries do not follow identical trajectories
• Different groups within a country can experience very different disease burdens
• Poverty and inequality shape every stage
• Infectious processes can contribute to “chronic” disease
• HPV → cervical cancer
• H. pylori → peptic ulcer/gastric cancer
• Hepatitis B/C → liver disease/cancer
• New infectious threats can emerge or re-emerge
Proportion ≠ risk
• Imagine deaths from Disease A fall dramatically.
• Deaths from Disease B stay exactly the same.
Disease B now accounts for a larger proportion of all deaths Does that mean the risk of dying from Disease B has increased for everyone?
Changes in the distribution of causes of death are not necessarily
changes in cause-specific risk.
What is a chronic disease?
Chronic disease is not a standardized epidemiologic category.
Definitions vary according to:
• Which diseases or conditions are included
• Required duration
• Whether the condition must require ongoing care
• Whether it limits functioning
• Whether it can be cured
• Whether disabilities are included
• Whether communicable diseases can be chronic
Duration-based definition of chronic disease
Persistent or long-lasting
Function/care-based definition of chronic disease
Requires ongoing medical attention and/or limits daily activities
Disease-list based definition of chronic disease
Specified conditions are classified as “chronic”
chronic vs noncommunicable
Chronic ≠ noncommunicable
Chronic
Describes duration/course
Long-lasting or recurrent
Noncommunicable
Describes mode of transmission
Not directly transmitted person-to-person
WHO currently uses “NCDs” and “chronic diseases” interchangeably, whereas Bernell & Howard specifically demonstrate why this creates conceptual problems.
is HIV Chronic or noncommunicable
communicable + chronic
its a virus so it can be transfered across ppl
also w/o treatment it can turn into something that chronic cuz it can require life long management
are Some cancers or noncommunicable
noncommunicable but may have relatively short courses
is Chronic hepatitis Chronic or noncommunicable
communicable origin + chronic condition
Disease trajectories change – HIV
• Earlier in the epidemic: infection → severe illness → premature death
• With effective treatment: infection → long-term management → ageing with HIV
• Advances in treatment can transform the lived and epidemiologic meaning of a disease.
why do Definitions matter
Definitions are measurement decisions and measurement decisions have consequences.
How we define chronic disease determines:
• Who is counted
• Which diseases enter surveillance systems
• Estimated prevalence
• Which populations are studied
• Which services are funded
• Which conditions receive policy attention
• Whether findings across studies are comparable
What about “health” (who)
Health is “a state of complete physical, mental and social wellbeing and not merely the absence of disease or infirmity.”
major conceptual changes
moves away from traditional biomediclal model and includes social and mental
Can a person have a chronic disease and still be healthy?
WHO's constitutional definition deliberately broadened health beyond absence of disease.
if presenese of disease automatically means absence of health can an individual with a well manged chronic disease be considered ehalthy
What about “health”? (non who, bmj )
• Health may be dynamic, not binary. A challenge to the WHO definition:
• If “complete” wellbeing is required:
• Are most people unhealthy most of the time?
• What does health mean for someone living well with diabetes, HIV, disability, or another long -term condition?
conceptual change: goign from binary definition to health coexsiting with disease
Causes of cases
Why did this person develop disease?
• Individual susceptibility
• Individual exposures
• Clinical risk factors
Causes of incidence
Why does this population have more disease?
• Distribution of exposures
• Social/environmental conditions
• Population-level determinants
Causes of cases vs Causes of incidence
The causes of individual cases may differ from the causes of differences in disease rates between populations.
Frameworks
Life course, Social determinants of health, Ecosocial Theory
These frameworks provide complementary ways of understanding why chronic diseases develop and why they are unequally distributed.
Framework 1: Life course epidemiology
How do exposures at different stages of life shape later health and disease?
When does risk develop?
Examines how exposures and experiences across different stages of life shape later health and chronic disease.
the point where a disease diagnosis is not the casual point
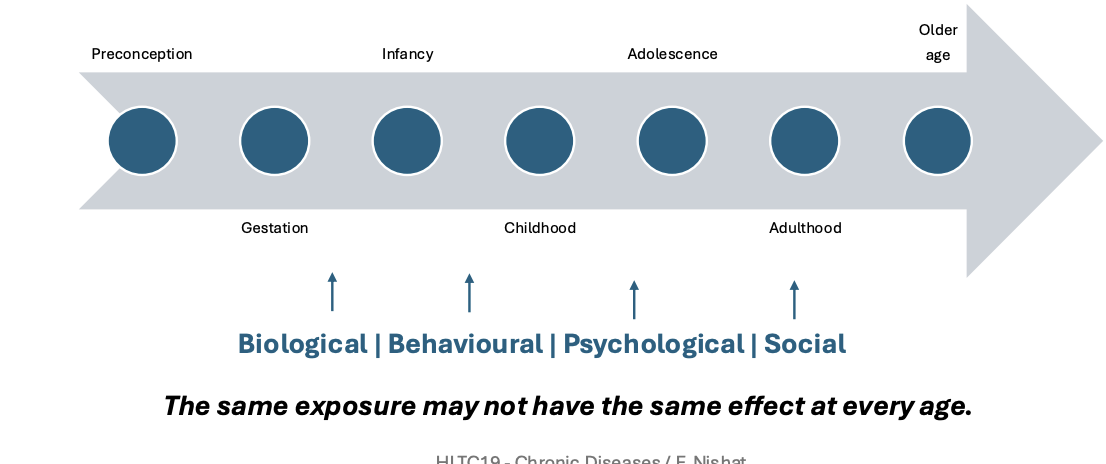
Critical period
A limited window during which an exposure can produce lasting effects through a particular developmental mechanism.
Sensitive period
A period when an exposure has a stronger effect than it would at another time
Accumulation of risk
Exposures build up over the life course, such that the total burden and duration of exposure influences later disease risk.
Disease risk may increase with:
• Number of adverse exposures
• Duration of exposure
• Intensity of exposure
• Repeated exposure across life stages
Risks can cluster
An individual exposed to socioeconomic disadvantage may simultaneously experience:
• poorer housing
• greater pollution
• food insecurity
• fewer safe opportunities for physical activity
• greater chronic stress
• occupational hazards
• reduced access to preventive care
Risk factors are socially patterned and often travel together.
Childhood disadvantage
→ fewer educational opportunities
→ precarious employment
→ lower income
→ poorer housing / greater stress
→ chronic disease risk
Early exposures can alter the probability of later exposures, although this is not determinist.
Framework 2: Social Determinants of Health
What social conditions shape risk?
Examines how the conditions in which people live, learn, work, and age influence health and the distribution of disease.

Upstream factors: People living near a river become ill from drinking water.

downstream factors: People living near a river become ill from drinking water.

which is more imp: Upstream and downstream factors
Both can matter, but they intervene at different points in the causal chain.
Health follows a social gradient
Across many populations:
• Increasing social advantage → progressively better health
• Increasing social disadvantage → progressively poorer health

Framework 3: Ecosocial theory
• Ecosocial theory examines how social, political, economic, and environmental conditions become biologically embodied, producing patterns of health and disease in populations.
• Our biology develops within (not separate from) our social and environmental context.
How do social and biological processes connect? Examines how social and environmental conditions become embodied, producing patterns of health and disease across populations.
Embodiment
The process through which social and environmental conditions become biologically incorporated into the body.

Pathways operate across ____ and over ___
levels, time
Exposures, susceptibility, and responses are shaped at multiple levels:
Pathways operate across levels and over time examples

Pathways operate across levels and over time ckd
Chronic kidney disease is long-term condition in which the kidneys are damaged or have reduced function over time.
diagnosis may occur in adulthood but, casual factors can arise as far as childhood
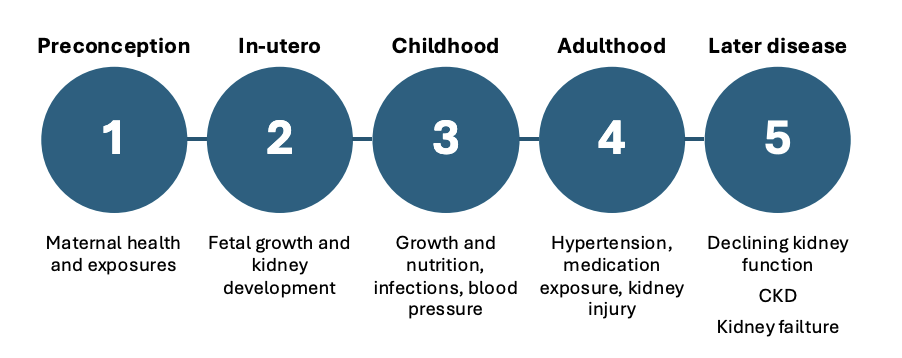
Social context of CKD
these factors determines who faces an hazardous env snd who can combat/ mitigate them, present at every stage of life course
Living conditions
• Food affordability
• Housing
• Environmental exposures
Working conditions
• Heat exposure
• Physical hazards
• Employment conditions
Healthcare access
• Primary care
• Screening
• Medication
Structural or social conditions
• Income
• Education
• Geography
• Discrimination
• Social policies
Interventions for CKD
dont gotta useall at the same time depends on the stage of disease and life point

But WHEN do we intervene?
earlier intervention does not replace care whereas later care doesnt make earlier prevention irrelevent

whats the significance of this
they arent all measuring the same thing, the goal of this lecture is to unerstand what it each measure
What does “burden” mean?
The measure we choose depends on the question we are asking

Public health surveillance
The ongoing, systematic collection, analysis, interpretation, and dissemination of health data for public health action.
Public health surveillance importance
Surveillance tells us what is happening, to whom, where, and when.
general history of Public health surveillance

Data sources for surveillance
Vital statistics
Population surveys
Administrative health data
Disease registries
Electronic medical records
Census / population data
Vital statistics - example, Information Provided, Strengths, limits
example - Death registrations
Information Provided - Deaths and underlying/ contributing causes of death
Strengths - Population-level coverage; allows mortality trends and cause-specific mortality
limits - Cause of death may be misclassified; does not capture non-fatal burden
Population surveys - example, Information Provided, Strengths, limits
example - Canadian Community Health Survey (CCHS)
Information Provided - Self-reported diagnoses, symptoms, behaviours and sociodemographic characteristics
Strengths - Captures factors not routinely available in health records; includes people regardless of healthcare use
limits - Self-report and recall bias; non-response; smaller samples for subgroup analyses
Administrative health data - example, Information Provided, Strengths, limits
example - Canadian Chronic Disease Surveillance System (CCDSS)
Information Provided - Diagnoses identified from physician claims and hospital records; prevalence, incidence and healthcare use
Strengths - Very large populations; longitudinal; useful for trends and subgroup comparisons
limits - Depends on healthcare contact and coding; limited clinical, behavioural and social information
Disease registries - example, Information Provided, Strengths, limits
example - Canadian Cancer Registry
Information Provided - Disease-specific incidence, characteristics and outcomes
Strengths - Standardized, disease-specific information; often high completeness
limits - Limited to selected diseases; reporting/data availability may lag
Electronic medical records - example, Information Provided, Strengths, limits
example - Canadian Primary Care Sentinel Surveillance Network (CPCSSN)
Information Provided -Diagnoses, prescriptions, laboratory results and clinical measurements
Strengths - Richer clinical detail than administrative data
limits - Participating practices may not represent the whole population; variable data completeness
Census / population data - example, Information Provided, Strengths, limits
example - Census of Population
Information Provided - Population size, age, geography and sociodemographic characteristics
Strengths - Provides population denominators; allows small-area and equity analyses
limits - Limited direct information on diagnosed chronic disease; collected periodically
PERSON - Who is affected? example from Health of Canadians, 2024
Sex: prevalence was 48.9% among females vs 43.3% among males

PLACE - Where is burden higher? example from Health of Canadians, 2024

TIME - How is burden changing example from Health of Canadians, 2024

COUNT
Number of people/events
the number itself
on their own difficult to compare across populatiom
COUNT example
Heart disease is the 2nd leading
cause of death accounting for 57,890
proportion
The number of people/events over a relevant denominator. Can be expressed as %
helpful for comapring population
proportion example
46.1% of Canadian
adults reported
≥1 selected
chronic disease
in 2023
how is proportion easy to comapre over pop exMPLE
Community A
10,000 people with diabetes, Total population is 1,000,000.
Community B
5,000 people with diabetes.
Total population is 100,000.
A = 1%
B = 5%
RATE
ncorporates the number of events over time. Expressed as expressed per 1,000 or 10,000, or population
Tells us how quickly an event is hapenning
RATE example
The age-standardized incidence rate of colorectal cancer in Canadian males is 63.0 per 100,000 population
Prevalence
• Includes people currently (old + new) living with the disease
• Usually expressed as a proportion or percentage
• Reflects disease burden at one point or during a period
Prevalence formula
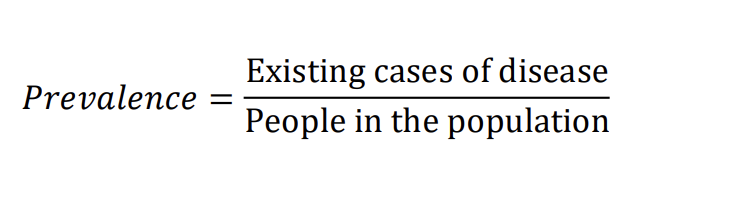
types of Prevalence
Point prevalence
Period prevalence
Point prevalence
Disease present at a particular point in time
• Example: Prevalence of diabetes on January 1, 2026
Period prevalence
Disease present at any time during a defined period
• Example: Prevalence of diabetes in the past 5 years (Jan 2021 – Dec 2026)
Interpreting prevalence
• 19.9% of Canadian adults reported having high blood pressure in 2023.
• Correct interpretation: Approximately 20 in every 100 Canadian adults surveyed reported having high blood pressure.
• Incorrect interpretation: 19.9% of Canadian adults developed high blood pressure in 2023.
• Prevalence describes existing disease not new disease.
what does Prevalence depend on
• Prevalence depends on both how often disease develops and how long people live with it.
Prevalence can rise because:
• incidence increases
• survival improves
• disease duration increases
• recovery decreases
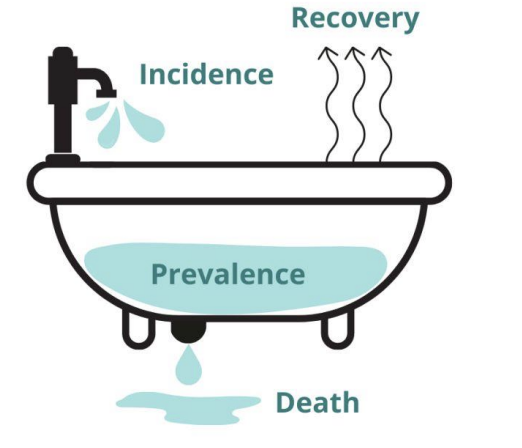
Incidence
• Occurrence of new cases of disease among people at risk over a specified period
Incidence formula

two measures of incidence
(1) cumulative incidence and
(2) incidence rate
Cumulative incidence
• Used when all individuals are followed for the entire period of time
Cumulative incidence formula

Cumulative incidence example
• 500 diabetes free people followed for 5 years
• 50 develop diabetes
• 50/500 = 0.10 = 10%
• Interpretation: The 5-year risk of developing diabetes was 10%.
• 500 individuals in the population, 250 already have diabetes, everyone is followed for 5 years
• 50 develop diabetes
• 50/250 = 0.20 = 20%
• Interpretation: The 5-year risk of developing diabetes was 20%.
Incidence rate
• Used when individuals are not followed for the entire period, the denominator now requires a unit of time.
• Gives us information about the speed at which new diseases occur.
Incidence rate formula

Incidence rate example
• 500 individuals in the population, followed for 2,500 person-years
• 50 develop diabetes
• 50/2,500 = 0.02 x 1,000 person-years
• Interpretation: There were 20 cases of diabetes per 1,000 person-years of follow-up time.
Prevalence vs Cumulative Incidence vs Incidence Rate:Cases included
Prevalence : Existing (new + old)
Cumulative Incidence : New
Incidence Rate: New
Prevalence vs Cumulative Incidence vs Incidence Rate: Denominator
Prevalence : Population
Cumulative Incidence : Population at risk
Incidence Rate: Person-time of follow up
Prevalence vs Cumulative Incidence vs Incidence Rate: Question
Prevalence : How common is the disease?
Cumulative Incidence :How frequently is the disease developing?
Incidence Rate: How quick is the disease developing?