Exploring and Pre-Processing Data
 Call Kai
 Learn
Learn Practice Test
 Spaced Repetition
 Match
Match Flashcards
 Knowt Play
1/26

There's no tags or description
Looks like no tags are added yet.
Name | Mastery | Learn | Test | Matching | Spaced | Call with Kai | Chat |
|---|
No analytics yet
Send a link to your students to track their progress
27 Terms
What are the diff Variable Types?
Data, Rows, and Columns
Rows can also be called
Record, Data Point, Instance, or Case
e.g. customer, tax return, applicant
Columns can also be called
Fields, attributes, Features, Dimensions
e.g. age, income, temperature
Nominal or Categorical Variables
Categorical - Not ordered can say X does not equal Y but not X>Y or X<Y
e.g. colors, phone numbers
NOMIAL DATA
Ordered(Ranked) - Ordered can say X>Y but not by how much
e.g. grades
ORDINAL DATA
Numerical or Continuous - Intervals
Ordered and can say the diff X-Y but not exactly the other operations such as multiplication
Numerical or Continuous - True Numeric
Support all mathematical operations, measures from a meaningful zero point
e.g. weight, height, length
Example of a variable that may look like numeric while it is categorical
Zip code, IP address
Some algorithms expect variables to certain types…
Statistical regression and Neural Networks expect NUMERIC inputs
Decision trees expect categorical or ordered inputs

Numeric
Most algorithms can handle numeric data
May need to “bin” into categories

Categorical
Naive Bayes can use it as-is
In most algorithms, must create n or n-1 binary numbers
Columns with unique values
Customer ID
Telephone number
Address, Zip Code
These categories are NOT that meaningful in mining data
Sometimes they can contain useful information
e.g. geographic, starting year, etc
Columns - Derived Variables
Results from calculations
e.g. total sales
Unary
Columns with one value
NO value for data mining
They should be ignored because they lack any information
Almost-unary
Columns with almost only one value
No VALUE for data mining
Rule of thumb: 95%-99% of the values are identical, the column should be ignored
Important to understand WHY the values are so skewed - why is it almost unary?
Discrete Values
Basic Plots
Line graphs
Bar Charts
Scatterplots
Distribution Plots
Histograms
Continuous Values
Mean, median, mode, range, variance, standard deviation
Boxplots
Correlation
Histograms
Shows the distributions of the outcome variable
e.g. median house value
bins of value - x, frequency counts - y
Range
Difference between the smallest and largest observation in the sample
Max - Min
Median
Midpoint of values after they have been ordered from smallest to largest, or largest to smallest
Mean V.S. Median
Median is not affected by the extreme values or outliers!

Symmetrical Distribution
Mean, median, and mode are symmetrical

Positive Skew
Mean is right skewed
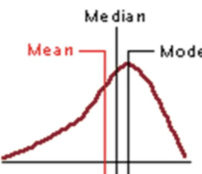
Negative skew
Mean is left skewed

Extreme Values → Very likely
Find outliers in age and income → remove them to clean data (not likely)
Outliers are an extreme values but extreme values are not outliers
Correlation
A measure to see the change in one variable to another
r is between [-1,+1]
The closer the value of r to 0, the smaller the correlation
What happens when you remove a variable - highly correlated
You can remove a variable and you will not MISS anything, if it is highly correlated
Exploring the data
Using statistical methods to gather and understand the dataset provided
Examine distributions
Study histograms
Investigate extreme values
Compare values with descriptions
Validate assumptions
Note prevalence of missing values