2.1
 Call Kai
 Learn
 Practice Test
 Spaced Repetition
 Match
 Flashcards
 Knowt Play
1/183

There's no tags or description
Looks like no tags are added yet.
184 Terms

what can balance of payment show 1
our competitiveness as a country to achieve long run econ growth
what is the balance of payment
a record of country’s transactions with the rest of the world
3 sections of the balance of payment cfc
current account
financial account
capital account
components of current account gs ni ct
trade in goods (visible goods)
trade in services invisible goods
net investment
current transfers
components of capital account ao df
transferes of asset ownership+ debt forgiveness
financial account d h dc ra
Direct investment flows
hot money flows
put money into different countries
resource assets
current account of uk
budget defecit → leakages laeding to trade defecit in goods
surplus in services
exports in balance of payments
positive on the balance of payment = inflow of money
imports on balance of payments
negative on balance of payments = outflow
if x>m what does that mean for current account
current account surplus
if x<m on current account
current account defecit
balance of trade in goods
net exports of visible goods
uk trad run a large defecit on the tade of good component
reasons for defecit on balance of trade in goods in uk
increase of demand in consumer goods
decline in uk manufacturing sector
lower production in mats such as gas and oil
strong currencty
balance of trade in services
measures net exports fo invisible items
uk traditionally run a large trade surplus on the trade in services
hard to judge the value of these therefore measurements may be inaccurate
why is the a trade surplus on the trade in services for uk
shift away from pimary and secondary sectors towards tertiary sector
specialisation of these → uk more competitive in the provision of these
london has developed as one of the world’s prime financial centres - major source of income in the uk
primary income on balace of trade
dividends /assests
usually positive in the uk
secondary income uk
anything given to trading blocs
When did uk have a conrete example of trade surplus
2021- brexit
businesses stockpiled on imports due to fears before we left eu
as a result not as many imports in 2021
causes of current account defecit ae , eg, tb d
appreciation of currency
economic growth
mebership for trade blocsmore competitive
deindustrialisatio

impact 1 on changes in current account on the economy
increased cost of imports → inc cost for firms → cost-push inflation

impact 2 on changes in current account on the economy
creates interdependent economies

impact 3 on changes in current account on the economy
indicates an unbalanced economy

impact 4 on changes in current account on the economy
a possible loss of AD and slower growth leading to a lack of competitiveness

evaluation points for defecit on current account 1
IDO- if defecit arrives from an excess of imported materials that will be converted into products that we will then export

evaluation points for defecit on current account 2
IDO- if defecit is offset by a net inflow of direct and portfolio investment

evaluation points for defecit on current account 3
IDO- how long the defecit lasts

evaluation points for defecit on current account 5
How large the defecit is
evaluation points for defecit on current account 6-7
marshall-lerner effect
J curve
Marshall Lerner condition
specifies the conditions for when the depreciation of an economy’s currency will improve its trade balance
trade deficit only improves when the country has a combined elasticity of imports and exports greater than 1 therefore elastic
country will change its habits to spending at home or on domestic goods
j curve short terms
immediately after depreciation, current account worsens
imports dear
exports cheap
short term, quantity demanded for xm doesn’t change as much as businesses are in fixed contracts and take time to adjust to contracts
country continues buying same number of imports
value of imports related to exports
j curve long term
over time current account improves
firms and consumers have had time to respond to changes in price
foreign consumption of exports rises
domestic consumers shift away from imports to cheaper domestic goods
econ growth
uk surplus
2021 post brexit deal
companies stockpiled imported goods in order to prepare for the increase in costs brexit brings
therefore there was less of a need for imports leading to a current account surplus

cause 1 of current account deficit £
appreciation of currency = SPICED
causes of current account deficit 2 🤑🤑🤑🤑
economic growth
mpm grows leading to a worse position on the current account deficit
reason for current account deficit 🇪🇺🇪🇺🇪🇺🇪🇺
membership of trading bloc fees
cause 1 of current account surplus 🏟
increase in competition
benign deflation
reason for current account deficit 🏭
deindustrialisation
more goods imported
PED
responsiveness of demand to changes of price
elasticity ped for holidays as they luxury goods
YED
income elasticity of demand
the responsiveness of demand to changes in income
negative rs for staycations
demand
the quantity of goods and servies consumers are w/a to buy at a given point in a given time period
law of demand
inverse rs between price and quantity demanded
as price increadse, quantity demand decreases → assuming ceteris paribus
Increase in price on curve means?
contraction of demand
decrease in price on curve means
extension of demand → down the curve
Why is there a downwards slope for demand
income effect
substitution effect
income effect chain of reasoning
prices increase ( vice versa applies )
income purchasing power can’t go as far
consumers are lkess able to buy the same quantity of goods and services
demand contracts
substitute effect chain of reasoning
prices increase ( vice versa applies)
other g/s become price competitive
switch our demand to buying different goods and sevrices
demand of specifc good contracts
when assumption of ceteris paribus is dropped what happens to demand
we can allow non-price factors to affect demand
what do non-price factors do to the demand curve
shift it
neumonic for non-price factors
Pasific
p in pasific
population
increase in pop,
increase in demand
shifts demand right
vice versa
a in pasific
Advertising
good advertising
increase in demand
(vice versa)
s in pasific
substitute’s price
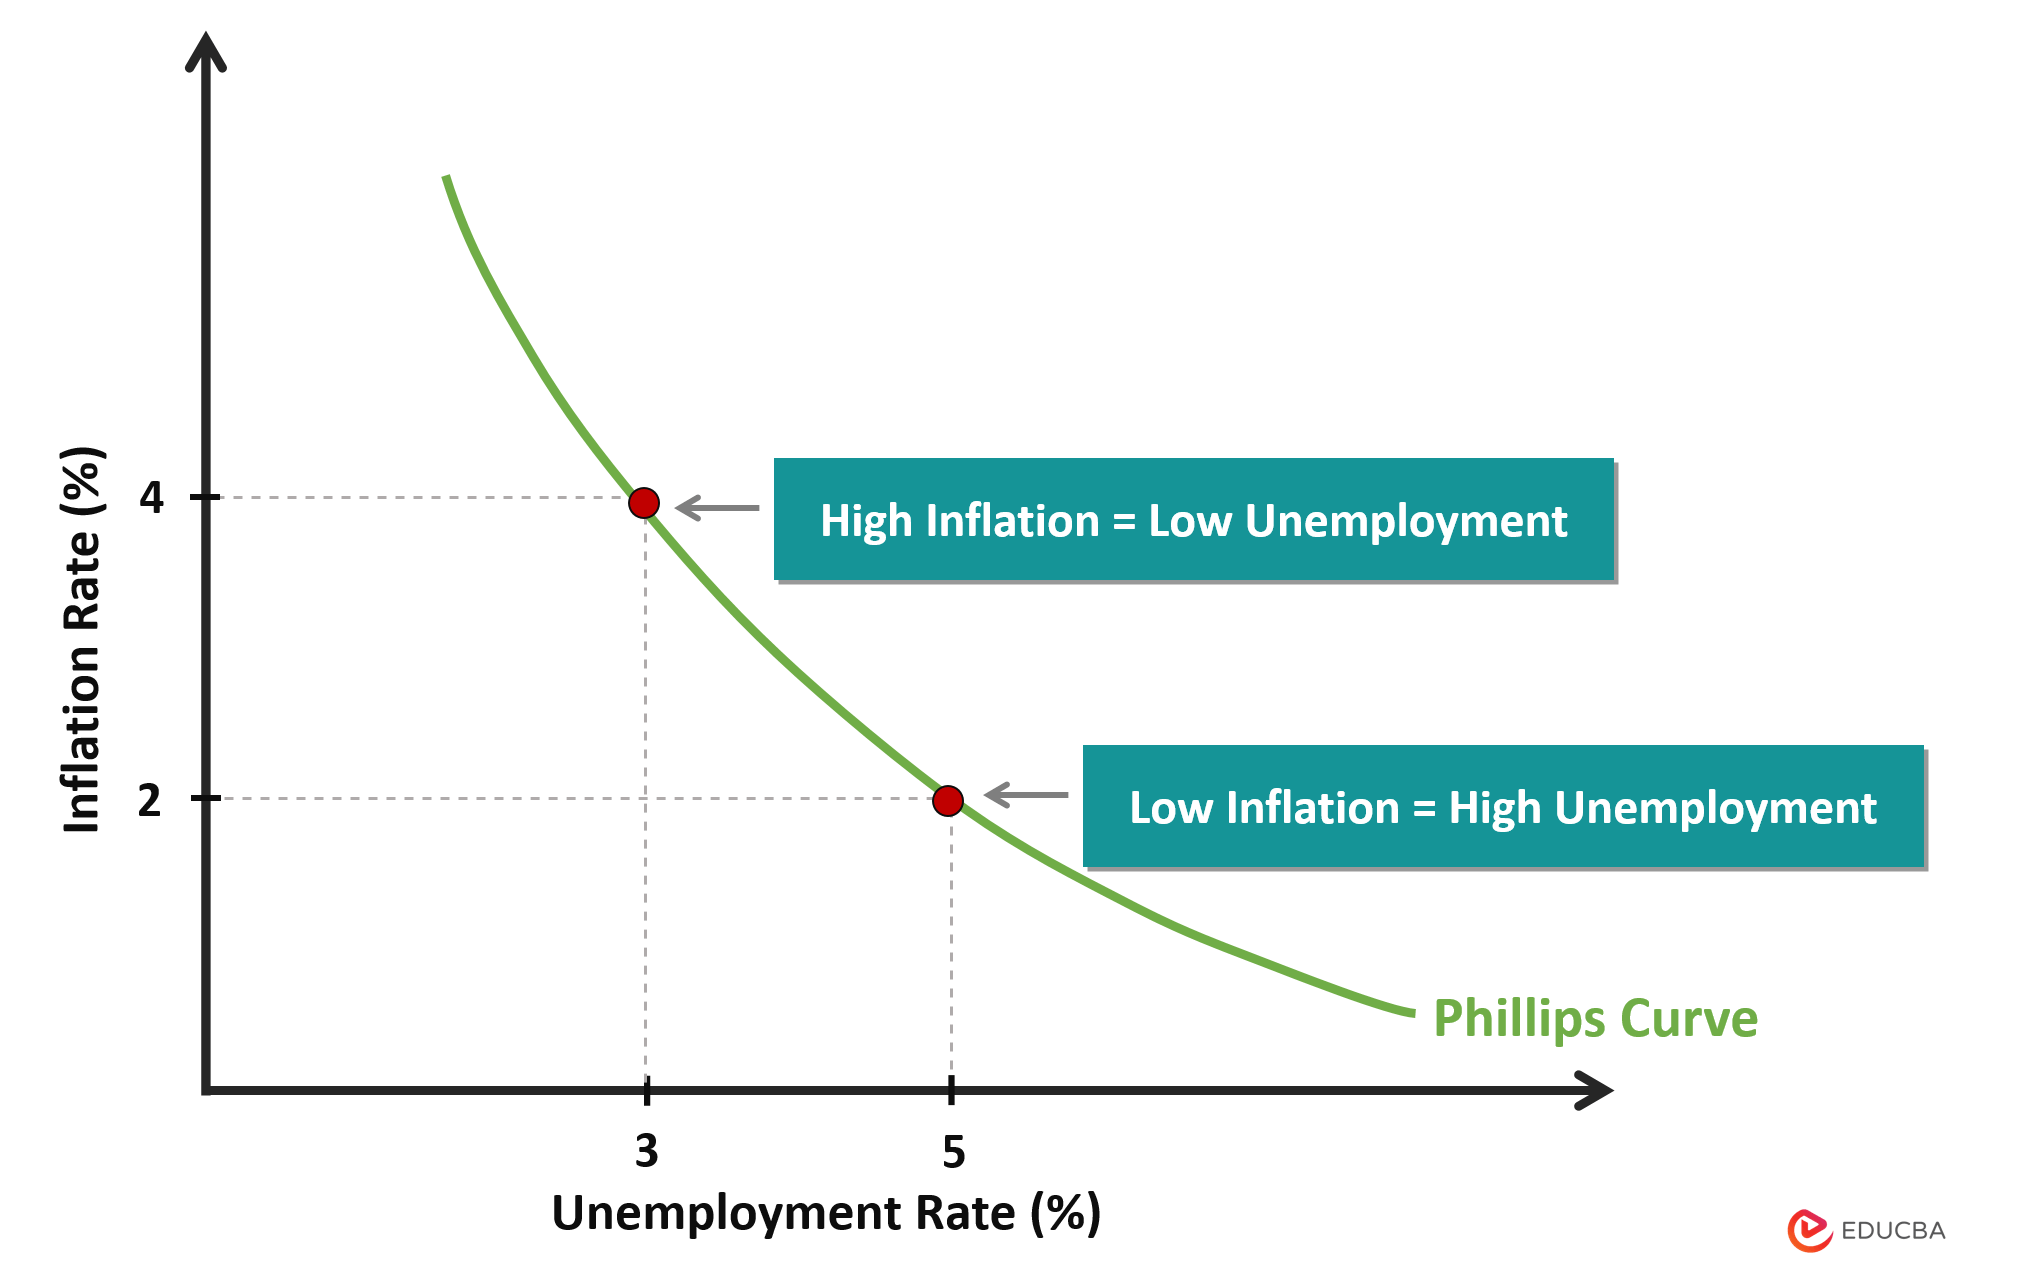
what’s this curve rep
phillips curve
inverse relationship between unemployment and inflation
chain of analysis for inverese rs 1
low levels of unemployment
increase in consumer confidence
increase in consumption
increase in ad
increase in production bc busiinesses want to make more to sell more
increased ddl
increase in wages bc businesses want workers
increase in price for firms to maintain profit margins
chains of analysis for inverse rs on phillips curve two
demand pull and cost push inflation
govt take contractionary measures/ policies to tackle this reduce inflation
consumers anticipate further decrease in prices so are less w/a
fall in c
fall in ad
firms experience low levels of sales
less incentive to produce more
derived demand for labour falls
leads to rising unemployment
stag flation
characterised by high inflation, sluggish economic growth and high unemployment
Employed
Thos who do more than one hour of paid work a week or are temporarily away from work
unemployed
those who are willing and able to work but can’t find a job but are available to start in 2 weeks
Economically inactive
those who are neither employed or unemployed- of working age but not actively seeking employment / seeking but cant start work
activity/ participation rate
percentage of population of working age and are economically active
measures of unemployment
claimant count
LFS
claimant count +criteria
number of ppl recieving unemployment benefits
must be 18+
not in full time education
available to work
savings <16k
benefits of using claimant count to measure unemployment figures
quick and easy to calc
cheap to conduct as it is administrative by product of providing welfare benefits
drawbacks for using claimant count to measure unemployment figs
not everyone entitled for jsa
stigma behind claiming benefits- reduces likelihood
underreports unemployment
Labourforce survey
sample of 60k households in uk - legal req for every country in uk
sampling survey
carried out by ons
unemployment circumstances of uk population
benefits of LFS
internantionally recognised
potential analysis as it measures diff job sectrs
picks up trends in sectors
generally accepted to be more accurate
drawbacks of LFS
v expensive and time consuming to conduct and compile
subject to sampling and extrapolation errors
Full employment
when numb of job vacanceis= the number of ppl actively seeking work
impossible to achieve inreality bc natural rate of unemployment exists
around 3-5%=nautral
frictional unemployement
due to ppl movingbetween jobs
good unemployemnt- comp in job mrkt
highest part of unemployment figures in uk
structural unemployment
occurs when there is a permanent mismatch between the skills or location of the workforce and the requirements of available jobs in the economy
leads to long term decline in demand
reduction in employment
skills cant be transferred - imobillity
occupational immobility
when worker has specific skills that are not neccessarily needed in growing industries
geographical immobility
barriers to ppl moving from one area to anothr
regional strtuctural unemployment
certain areas of a country suffer from very low level of unemployment due to industyry closures - made worse bc a fall in employment leads ot a fall in demand for businesses within the same area → more closures and job losses
sectoral structural unemployment
one sector suffers a dramatic fall in unemployment
Technilogical strucural unemployment
improvement to tech → jobs are replaced
seasonal unemployment
some employment seasonal in demand making some workers redundant during different periods -tourism
small portion of uk stats
we have seasonally adjusted figures bc these distort unemployment figures
it seeks to smooth out fluctuations in unemployment levels to provide more accurate stats
cyclical unemployment
due to a genral lack of demand of goods/services within an economy
causes a fall in ddl
normally when there is a recession or a severe slowdown in economic growth

Real wage inflexibility/ classical unemployment
unemployment as a result of wages being above their market clearing level leading to excess supply of labour
Impacts of migration on unemployment and employment
depends on if skills are complementary or substitutes - increase in migration means more increased jobs
often fill jobs in sectors such as nhs
complementary skills
fills the gaps in the sector therefore in higher demand
likely adds to workers marginal revenue product and puts upwards pressure on wages
substitutes
skills that ppl already have in the economy that the migrants move to - increases unemployment as it increases competition for jobs
it also puts downwards pressure on wages too
impact of unemployment on workers
wasted resource
lose existing skills if unemployed for long term
often suffer from stigma of being unemployed and feel degraded
loss of income
impacts of unemployment on firms
tend to be a decrease in demands for goods - depends on elasticity of demand- could lead to a fall on profit
long term unemployment means loss of skills for workers so employers have smaller skilled pool to employ from
they can offer lower wages → profits rise
impacts of unemployment on consumers
those in areas of high unemployment lose out bc of local shopping centres being rundown- can’t offer a range of shops like in areas of low unemployment → short temr negative econ growth
suffer from less choice- quantity of goods may fall
firms may lower prices so it may benefit consumers
impacts on govt of unemployment
govts spend extra on welfare pauments for those out of work - families too- therefore tax revenue falls
opportunity cost bc money could be better spent elsewhere
increase budget deficit - less spending on merit goods and public goods
impacts of unemployment on soc as a whole
rising unemployment figures is linked to social deprivation- a rise in crime rates - no causation but some correlation
areas of high unemployment see a fall in local demand for goods and services
long term unemployment can be an issue - damage economy’s growth potential so country is unable ro achieve desired ppf
benefits of unemployment
lower consumption and ad so lower inflationary pressure on prices
periods of unemployment give workers opportunity to upskill
Underemployment
a situation where a worker is employed, but their job fails to fully utilize their skills or provide sufficient hours and pay
Visible Underemployment
Working part-time or fewer hours than desired when full-time work is unavailable.
Invisible underemployment
Holding a job that does not match your education, experience, or qualifications- requires extensive surveying that compares worker’s skills to job requirements

Impacts of underemployment 1
Increased poverty levels / Financial Strain: Leads to lower take-home pay and in-work poverty.

Impacts of under-employment 2
Fall in GDP

Impacts of under-employment
workers lose their skills/Wasted Potential: Results in lower economic productivity and underutilized national resources. This is bc workers can’t update their skills leading to strucutral unemployment

Evaluation for under-employment
impacts depend on if govt put money into paying for degree apprenticeships+ graduate roles
Gig economy causing underemployment
Freelancing roles- w/a to give hours but not hitting minimum wage- no workplace protection
resulting in underemployment
Gig economy
Labour market characterised by the prevalence of contracts/freelance work as opposed to permenant jobs
results in high levels of underemployment
Mass unemployment
1 in 10 officially in labour force counted as being out of work
long term unemployment
being out of work for at least a year

Evaluation 1 for impact of unemployment
IDO- how long ppl unemployed for
lower impact if its for a shorter period