Climate Change Exam 2
 Call Kai
 Learn
 Practice Test
 Spaced Repetition
 Match
 Flashcards
 Knowt Play
 Podcast
1/57

Earn XP
Description and Tags
58 Terms
Equilibrium Climate Sensitivity (ECS)
The long-term, steady-state global mean surface warming caused by doubling of pre-industrial CO2 concentrations (2xCO2), evaluated while holding continental ice sheets and vegetation fixed.
Transient Climate Response (TCR)
The global mean surface warming observed when atmospheric CO2 reaches twice its baseline level in an idealized simulation where CO2 increases steadily at 1% per year compounded (reached at year 70).
Effective Climate Sensitivity
A measure of climate sensitivity estimated from the response to a sudden quadrupling of CO2 (4xCO2) over a 150-year period, capturing rapid-to-intermediate feedbacks. Does not capture long-term feedbacks
Pattern Effect
The principle that global radiative feedbacks (particularly cloud feedbacks) depend on the geographic spatial pattern of surface warming and cooling, rather than purely on the global mean temperature change. (not directly from lecture slides)
Atmosphere-Ocean General Circulation Model (AOGCM)
Captures the physical fluid dynamics, thermodynamics, and momentum equations of the atmosphere, ocean, land surface, and sea ice without interactive dynamic biogeochemical cycles. Seasonal to decadal; regional)
Earth System Model (ESM)
Current state-of-the-art climate model class that couples physical AOGCM dynamics with interactive biogeochemical cycles (carbon, nitrogen, sulfur, ozone, dynamic vegetation, and atmospheric chemistry).
Modeling challenges (W6-1: Models)
uncertainty for the future. Can use RCPs to represent scenarios
Models depend on quality of observations
Hard to capture wide variety of time and spatial scales
Clouds remain a struggle with modeling
Trees are a struggle for land surface models
Models are able to reproduce large-scale, observed temperature changes very well
Precip not reproduced as well as temp changes
Glacial-Isostatic Adjustment (GIA)
The ongoing rebound and deformation of Earth's crust and mantle in response to the melting and redistribution of ice sheet mass since the Last Glacial Maximum (LGM).
Far-Field Sea Level Rise
The above-average SLR experienced in ocean regions distant from a melting ice sheet, caused by the release and global dispersion of water previously held close by the ice sheet's gravitational attraction.
Committed Sea Level Rise
The irreversible, long-term sea level rise locked in over centuries to millennia due to the deep ocean's thermal inertia and the slow relaxation of ice sheets, persisting even after greenhouse gas emissions stop. (not discussed in detail in slides)
Kelvin Wave
An eastward-traveling wave along the equator and up continental coasts (e.g., California) that depresses the thermocline and raises local coastal sea level temporarily by several inches to feet. Occurs during El Nino.
drivers of deoxygenation (W7-2 Ocean Impacts)
Stratification: warming and increased freshwater input to ocean reduce mixing.
Warming: lower solubility of O2 in warmer water •
Biological effects: Warmer ocean temperatures increase BOD; increased nutrient inputs (through coastal runoff or through upwelling) lead to oxygen depletion at mid-depths (100-1000 m).
Circulation changes: Slowing circulation and increased upwelling of oxygen-poor deep-water are linked to cc, can reduce O2 content.
SLR during last deglaciation (17,00-18,000 yrs ago)
12mm/yr
meltwater pulse 1a SLR (14,600 - 14,300 yrs ago)
50mm/yr
Current SLR
3.7mm/yr
Jet stream climate timescale
24 hrs
Fluid dynamics + precip timescale
36 hrs
Radiation + clouds + atm chem + land surf timescale
3-5 days
Ocean surface timescale
15 days (statistics)
Upper ocean layer + ice model timescale
3 months (statistics)
Deep ocean + biogeochemistry + volcanoes
years (statistics)
active vegetation + GHG emissions + particulate emissions
decades (statistics)
tipping element
aspect of the climate system that may have multiple stable states, transitions from one state to another due to reinforcing feedback loops
tipping point
the level of a particular forcing factor at which a tipping element commits to transition to a new stable state
ways to avoid overshooting tipping points
avoid thresholds, build resilience (reduce vulnerability to shocks) and control rate of forcing
Critical, near-term tipping point examples (discussed in W8-1 lecture)
Greenland: melt-elevation feedback
West Antarctic Ice Sheet
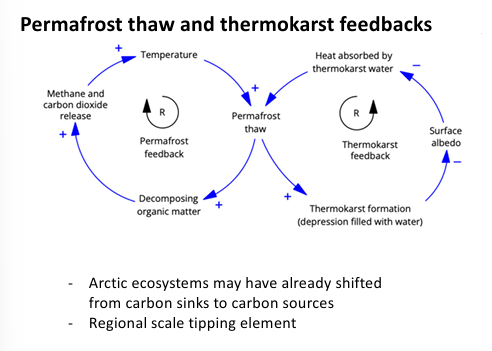
Permafrost thaw and thermokarst feedbacks
Amazon feedback
I highly anticipate she’ll ask us to discuss at least one of these on the exam
Greenland feedback
30 cm SLR may already be locked in
Mass loss greater than 0.4 m SLE would require 10,000s years at pre-industrial GHG concentrations to reverse
GMST of 3.2-3.4 ˚C >> potential for near-full melt of Greenland Ice Sheet over millennia

West Antarctic ice sheet feedback
long term SLR of 3-5 m
WAIS collapse w/0.5 - 1 C ocean warming above pre-industrial
May already be commited to collapse
(no causal loop diagram in slides)
Permafrost thaw and thermokarst feedback
Arctic ecosystems may have already shifted from carbon sinks to carbon sources
Regional scale tipping element
Amazon feedback
High confidence in local and regional tipping point
Low confidence that it is a continental-scale tipping point
Note also drought-fire (local) and climate-carbon cycle feedback (global, low confidence

Atlantic Meridional Overturning Circulation (AMOC)
warm salty surface water flows north (for example, thru Gulf Stream)
water sinks (near Greenland), becomes colder and saltier
meltwater and rain weakens sinking
cold, dense deep water returns south
slow upwelling
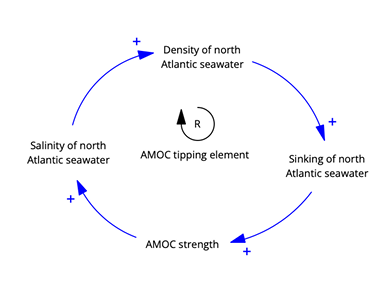
AMOC collapse and consequences
Evidence that AMOC is weakening, studies estimate collapse this century (now - 2095)
Actual tipping point is highly uncertain
Consequences of AMOC collapse include heat and precip distribution changes, higher sea levels along Eastern US
Colder northwestern European winters
Shifts in tropical rainbelts
Effects on other tipping elements
Agriculture’s share of CH4 emissions
38% of all CH4 emissions (23% comes from enteric fermentation)
Agriculture’s share of N2O emissions
80% of all N2O emissions (28% comes from synthetic fertilizers)