Chapter 7: Perform the Analysis: Diagnostic Analytics
 Call Kai
 Learn
 Practice Test
 Spaced Repetition
 Match
 Flashcards
 Knowt Play
1/32

There's no tags or description
Looks like no tags are added yet.
33 Terms
Since descriptive analytics answers the question, “What Happened?”, diagnostic analytics takes it a step further by asking
“Why Did It Happen?” and “What Are the Reasons for Past Results?
Diagnostic analytics are performed to investigate the
underlying reasons for past results that cannot be answered by simply looking at the descriptive data.
There are two broad types of diagnostic analytics
Identifying Anomalies/Outliers
Finding Previously Unknown Linkages, Patterns, or Relationships between and Among Variables
Identifying Anomalies/Outliers –
Often a first step in diagnostic analytics is to look for and identify unusual, unexpected results or transactions.
Once we have done an initial attempt trying to understand what might have occurred, we can investigate further to understand exactly why they occurred and if they identify an error or fraud, or just an extreme observation.
Finding Previously Unknown Linkages, Patterns, or Relationships between and Among Variables –
look for patterns in the underlying data set by summarizing data at different levels and uncovering additional details to understand why something happened.
Accountants’ have varying expectations on a specific issue
Accountants expect certain levels of
performance or outcomes.When that doesn’t happen, it usually triggers additional investigation to figure out why.
Management by Exception
A managerial style that allows management to spend its time addressing issues/problems.
Here are some examples of expectations versus anomalies Financial Accounting
The Accountant’s Expectation
Past year’s performance or the performance of other firms in the same industry.
Example of Anomaly
Profits tripled in the current year from the past.
Possible Explanation for the Anomaly/Outlier
New products are selling well and expenses are under control.
Here are some examples of expectations versus anomalies Managerial Accounting
The Accountant’s Expectation
Standard cost is used for each foot of decking product produced.
Example of Anomaly
There is a large labor rate variance. The per hour charge of direct labor at the factory is much higher than anticipated.
Possible Explanation for the Anomaly/Outlier
Our employees had to put in overtime to complete the work. Thus, an unfavorable labor rate variance occurred because overtime is 1.5 times normal pay.
Here are some examples of expectations versus anomalies Audit (External)
The Accountant’s Expectation
Generally Accepted Accounting Principles (GAAP) are used.
Example of Anomaly
PwC found its client capitalized R&D expenditures, contrary to GAAP.
Possible Explanation for the Anomaly/Outlier
The company bought long-term testing equipment for future R&D and argues it should be capitalized.
Here are some examples of expectations versus anomalies Tax
The Accountant’s Expectation
Taxable income generally increases when financial net income (on our financial books) increases.
Example of Anomaly
Taxable income decreases at the same time that financial net income increases.
Possible Explanation for the Anomaly/Outlier
Tax law changed making some types of income not subject to tax.
Here are some examples of expectations versus anomalies Audit (Internal)
The Accountant’s Expectation
University of Arkansas adopts segregation of duties as an internal control for paying cash disbursements – two signers for check when over $50,000.
Example of Anomaly
University of Arkansas’ internal auditor finds 15 checks greater than $50,000 only had 1 signer, violating their internal controls.
Possible Explanation for the Anomaly/Outlier
There are only two possible signers for checks, and one was out on family leave for an extended period.
There are various testing techniques and tools used in diagnostic analytics.
Sequence Checks and Sequence Analytics
Fuzzy Matching
Duplicate Transactions
Variance Analytics
Bank Reconciliation
Benford’s Law Used to identify fraud or irregular transactions
Sequence Checks and Sequence Analytics -
Why are some check numbers missing documentation?
Fraud or error?
Fuzzy Matching -
Some vendor addresses are similar to employee addresses.
Duplicate Transactions -
Why are there duplicates of some transactions in the financial reporting records?
Are they fraud or just errors?
Variance Analytics -
Typically performed in management accounting. Looks at differences from expectations
Why is the labor rate and labor use variance for direct labor unfavorable?
Bank Reconciliation -
Examines differences between transactions recorded by the bank and the G L.
Benford’s Law Used to identify fraud or irregular transactions -
Why does the first digit of some refunds offered by Verizon customer service representatives depart from the distribution expected by Benford’s Law?
Are they associated with fraud?
Benford’s Law evaluates the frequency distribution of first digits.

A similarity threshold helps evaluate the fuzzy matching results.

Type 1 and Type 2 errors help evaluate the model.
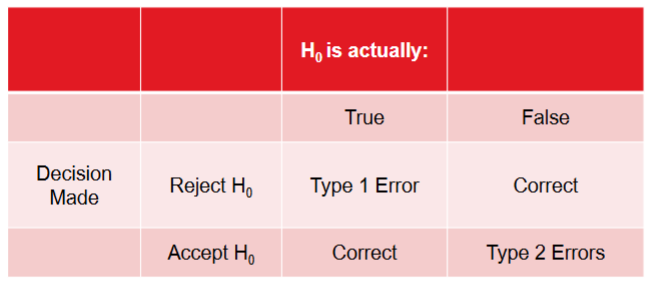
Type 1 and Type 2 errors occur in fuzzy matching if we set the bar too low.
Too strict –
tolerance too small –
type 1 errors
Too loose –
tolerance very big –
type 2 errors

Type 1 and Type 2 errors occur in
fuzzy matching if we set the bar too low.
What does “Moneyball” teach us?
The movie starring Brad Pitt tells the true story of finding patterns to identify undervalued talent for the Oakland Athletics in Major League Baseball.
This is an example of using analytics to find previously
unknown patterns
Drill-down testing/tools are used in diagnostic analytics: 1
Drill into the analytics to help explain …
why or how something has occurred:
Analysis of the Highest Owing Customer
Analysis of the Most Profitable Customer
Analysis of the Most Profitable Product
Analysis of the Highest Owing Customer:
Which customers included in the total accounts receivable owing have the highest balances outstanding?
Do some accounts need to be written off due to uncollectibility?
Analysis of the Most Profitable Customer:
By learning which customers are most profitable, the company can better work and cater to these customers.
Analysis of the Most Profitable Product:
By learning which products are most profitable, the company can better promote them to their customers. At the same time, they will be learning which products are not profitable and either work to make them more profitable (raise sales price, get product from another cheaper source), or just cut them from their offering altogether.
Hypothesis testing helps us determine how…
different two sets of data are.
Hypothesis testing using a difference in means:
Are Nordstrom’s sales returns as a percentage of sales higher during the holiday season (for example, Christmas, New Year’s, Hanukkah, etc.) as compared to the non- holiday season?
Is the average female executive salary lower than the average male executive salary?
Hypothesis testing using regression:
Are advertising expenses related to sales revenue outcomes?
Example of hypothesis testing 1:
Ask the Question:
(Hypothesis) Are the stock returns of Apple lower than the stock returns of Google (Alphabet) over the past 1, 5, or 10 years?
Master the Data:
The stock return data is available from Yahoo! Finance or other financial sources (such as Marketwatch, etc.).
Example of hypothesis testing 2:
Perform the Analytics:
Perform a t-test to statistically test the stock returns of Apple compared to Google (Alphabet). A t- statistic greater than 2 suggests that the stock price returns are different between Apple and Google (Alphabet).
Share the Story:
Provide the answer to the question to the investors to (1) see if there is a difference and (2) evaluate whether they should change their investments in Google or Apple.