HLSC280 Exam 2 Personal
 Call Kai
 Learn
 Practice Test
 Spaced Repetition
 Match
 Flashcards
 Knowt Play
1/73

There's no tags or description
Looks like no tags are added yet.
74 Terms
3 Versions of Pairwise Sequence Alignment
Dot Plots (or dot matrix analysis)
The dynamic programming (or DP) algorithm
Basic Local Search Alignment Tool (BLAST)
What are dot plots used to identify?
Regions of similarity within a single molecule (i.e repeats) or between different molecules
Nucleic acid sequences that have the potential for forming secondary structure by intramolecular base pairing
What is the principle used to generate dot plots?
A matrix comparison of two sequences (or one with itself) is prepared by “sliding” a window of user-defined size along both sequences.
Explain how window size, mismatch, and placing dots actually works?
When comparing two sequences together, a computer compares the sequences in window slices of values already preset, and if the amount of mismatches stays under or equal to the mismatch limit, a dot is placed in the center of the window.
Relationship between stringency, window size, mismatch limit, and sensitivity?
Stringency = window size - mismatch limit
Stringency is inversely proportional to sensitivity

Sequence is fully matching and aligned.

Sequence has a direct repeat.


Sequence contains an inverted repeat

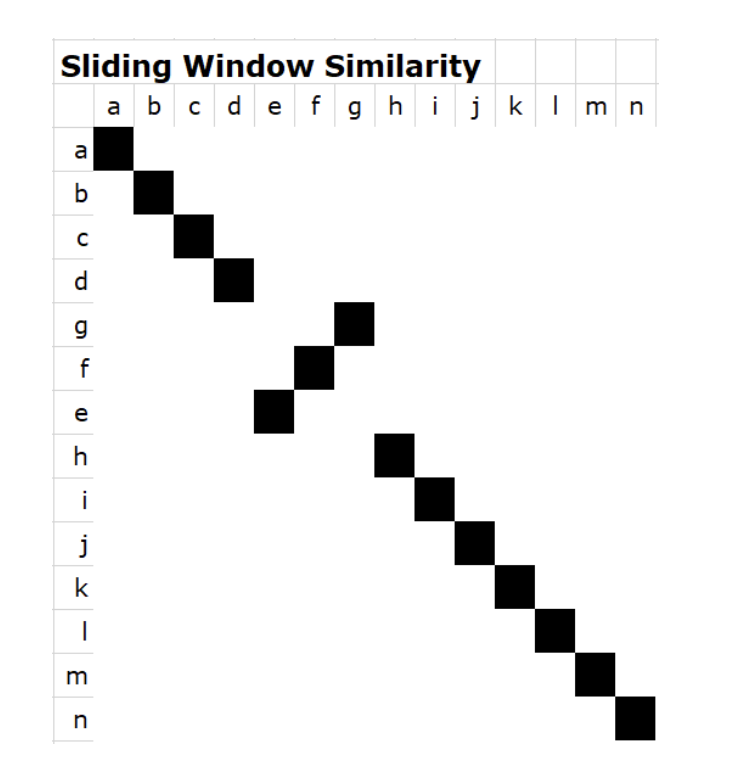
A region of one sequence is an inversion of the other one.

How can you adjust stringency?
You can make the window size much larger, making the stringency value a lot bigger, making the sequence alignment more strict which removes noise.

The sequneces contain a direct repeat within a direct repeat
Significance of a horizontal gap in a sequence
There is a insertion in the horizontal sequence or a deletion in the vertical sequence
Significance of a vertical gap in a sequence
There is a deletion in the horizontal sequnece or an insertion in the vertical sequence
Pairwise alignment definition
The process of lining up two sequences to achieve the maximal value of identity (and conservation, in the terms of amino acid sequneces) for the purpose of assessing the degree of similarity and the possibility of homology.
Identity definition
The extent to which two sequences are invariant
Similarity definition
The extent to which protein sequneces are related. Similarity takes into account conservation (substitutions that don’t change much due to similar traits in hydrophobicity and charge) and identity.
Conservation definition
Changes at a specific position of an amino acid that result in a different amino acid but the same physiochemical properties.
Dynamic programming is used to align what?
Two protein or nucleic acid sequences.
How is a scoring system really used in terms of BLOSUM62 and PAM250
A scoring system that favors the matching of related or matching amino acids and penalizes for poorly match amino acids and gaps
What are local alignments good to use for?
Match two sequences that are:
Have a matched region that is only a fraction of their lengths
Have different lengths
Overlap
Where one sequence is a fragment or subsequence of the other
PAM Matrices (Margaret Dayhoff)
Point Accepted Mutations (PAM) are based on amino acid substitution frequencies in a phylogenetic analysis of closely related proteins.
Negative values in the PAM250
Suggest that a substitution would be detrimental to occur, as it occurs less frequently than would be assumed by random chance. It is considered a bad substitution due to the amino acids having such different physiochemical properties that will do more harm then good. Think about it intuitively, if such an substitution would actually occur naturally, an organism would not live long enough to really show it, as such the substitution technically shows less than an assumed random chance value.
Neutral or 0 value in the PAM250
Suggests that the substitution of two amino acids occurs as frequently as would be assumed by random chance. This suggests that the two amino acids in question are very similar physiochemically, and neither serve as a positive or negative to an organism if a substitution were to occur.
Positive values in the PAM250
Suggest that a substitution is observed to occur more frequently than would be estimated by random chance. This is because the substitution is beneficial for an organism, and can help them survive longer and better. Doesn’t change protein function significantly (acceptable).
Applications for using a search for BLAST
Determining the identity of the DNA or protein sequence that causes a putative orthology
Discovering new genes or proteins
Investigating gene structure by comparing cDNA sequences and to genome sequences
Exploring amino acid residues that are important in the function and/or structure of a protein
Homology
When a gene or gene product share a common evolutionary ancestor but not necessarily the same function.
Orthology
Refers to genes that originated by speciation. Orthologues sometimes take over the function of the precursor gene in the species of origin and thus tend to be conserved.
Paralogy
The relationship between genes that have arisen due to gene duplication. Paralogues start out with redundant functions, which is an evolutionary unstable situation. Thus in the long run, paralogues either diverge functionally or all but one of the versions is lost.
blastn
Comparing DNA/nucleotide queries to a database of DNA/nucleotide sequences.
blastp
Comparing amino acid/protein queries to a database of amino acid/protein sequences
blastx
Compare a query nucleotide sequence to a protein database. Translates the query in all 6 possible open reading frames to find all possible amino acid sequences, which is useful for finding potential protein encoding,
tblastn
Compare a query amino acid sequence against a nucleotide database. Translates the potential nucleotide sequences into 6 open reading frames, useful for finding the gene of a point of interest.
tblastx
Compare a nucleotide sequence to against a nucleotide database. Both are translated in 6 open reading frames to compare protein sequences. Most computationally intensive search.
4 components of a BLAST search
Selection of the query sequence
Selection of the blast program (blastp, blastn, blastx, tblastx, tblastn)
Selection of the database to search (Most common choice is the non-redundant (nr) database)
Selection of optional parameters (substitutions matrices, filtering of low complexity sequences, etc)
3 phases of BLAST
Compile a list of word pairs with a pre-selected work length value above a threshold T
Scan the database for entries that match the compiled list. This is fast and relatively easy
When you manage to find a hit (i.e. a match between a “word” and a database entry), extend the hit in either direction
The BLAST algorithm is…
fast, sensitive, and the most easily web-acessible
What substitution matrix does BLAST use?
BLOSUM62
What’s the difference between BLOSUM62 and PAM250
PAM250 is designed for distantly related sequences, BLOSUM62 designed for moderately related (62%) pairs
Lowering the threshold value (T)
Increases the sensitivity and slows down the search speed
Increasing the threshold value (T)
Decreases the sensitivity and speeds up the search speed
What refinement was introduced in the 1997 version of BLAST?
Two independent hits were required to start the process of extensions. The hits must occur in close proximity with each other, occur on the same diagonal, and not overlap.
What was an advantage with the introduction of the two independent hit modification to blast?
Limit the extensions needed. Mathematically, with this modification, only one seventh as many extensions occur, greatly speeding the time required for a search
High Scoring Pairs
The seed matching and extension results in maximally aligned regions which, when significant, are called HSPs. BLAST often produces several short HSPs rather than a single aligned region.
How does BLAST search reporting work?
Shows top database hits, with a score (highest to lowest), and a e-value (lowest to highest). E-value works like p-value, where the lower the number, the better.
Explain the low complexity filter
A low complexity filter can be used to adapt your query sequence. The filter masks parts of the sequence by replacing low complexity sequences with “X” (unknown residues) symbols. Filtering can eliminate statistically significant but biologically uninteresting in your BLAST ouptuts, but they could also be beneficial to look at depending on your biological question.
Low complexity examples
Dinucleotide repeats, amino acid (aa) repeats, stretches of hydrophobic aa residues.
BLAST optional parameters
Choose the organism to search
Turn low complexity filtering on/off
Select the substitution matrix
Change the word size
Change the output format
Transcriptome
Complete set of all RNA molecules (mRNA, tRNA, rRNA) being transcribed in a cell/organism at a specific time.
What is transcribed in the process of transcription?
5’ UTR, CDS, 3’ UTR
Name some post-transcriptional modifications
Poly-AAA tail, 5’ guanine cap, alternative splicing
In eukaryotes, the CDS is divided into _________ _____ and the primary transcript is a ______ ____ of introns and exons
Multiple exons; faithful copy
Breakdown of RNA types in a cell
rRNA (ribosomal RNA) = ~80%
tRNA (transfer RNA) = ~15%
mRNA (messenger RNA) = ~1-5%
Overview of RNA-seq in prokaryotes

Overview RNA-seq method for the eukaryotic mRNA
Use of sequencing by synthesis but with a twist. The terminators in this sequencing are completely reversible, as a special chemical is released into the flow cell that removes the blocking group and fluorescent dye, turning the terminator back into a normal and extendable nucleotide with an OH group on the 3’.


Explain this image as much as you can.
The blue mountains represent the overlapping of reads for each portion of the transcript. The red lines under the blue graph represent the CDS, with the arrows within the CDS showing the direction it is reading. The blue overhangs that are represented by the mountain graph but not the CDS represent the UTR, where it is important to note that the 3’ UTR tends to be longer. Finally, the areas without any blue region are called intergenic regions.
True or False: the poly-AAA tail is encoded into the genome.
False; it is added as a post-transcriptional modification
Split-read
A read that is split by an intron. Split end reads can tell us about intron-exon junctions(paired ends can also do this) or transcript isoforms due to alternative splciing events.
Location of the central dogma processes
Transcription and post-transcriptional modification occur within the nucleus. The translation of transcript isoforms occur in the cytoplasm.

All the steps of A through E and what they show.
In example A, one of the paired RNA-seq reads (left read) maps/aligns fully to exon 1. The second RNA-seq paired read (right), maps/aligns in part to exon 1 and in part to exon 2. This ‘split’ read skips over the intron between exon 1 and exon 2 (because it comes from a fully processed mRNA that does not contain introns), effectively allowing us to determine the exact location of the intron-exon junctions. This is a good example of how RNA-seq split reads help us reconstruct the coordinates of exons and introns in a gene.
In example B, one of the paired RNA-seq reads (left) maps fully to exon 2. The second RNA-seq paired read (right), maps fully to exon 3. Those two reads still serve the purpose of telling us that the gene is expressed (producing mRNA) and the numbers of such reads mapping on the genome are indicative of the levels (abundance) of expression.
In example E, one of the paired RNA-seq reads (left read) maps/aligns in part to exon 1 and in part to exon 3 (therefore skipping exon 2!). This split read is a good example of how some RNA-seq split reads can provide evidence of alternative splicing events – in this case a ‘skipped exon’ event that occurred in mRNA isoform 2. The second RNA-seq paired read (right), maps/aligns fully to exon 3. It is still an informative reads with regards to measurement of level of RNA expression.
In example C, one of the paired RNA-seq reads (left) maps fully to exon 1. The second RNA-seq paired read (right), maps fully to exon 3. Those two reads still serve the purpose of telling us that the gene is expressed (producing mRNA) and the numbers of such reads mapping on the genome is indicative of the levels (abundance) of expression. These paired reads do not necessarily provide the evidence of exon skipping since each of them fully maps within an exon.
Why is RNA-seq so powerful?
Allows us to obtain full sequences of all RNAs (mRNAs, miRNAs, etc)
Highly quantifiable
Alternate splice variants can be detected
Alternate poly(A) site variants can be detected
Novel transcripts can be discovered
Deep transcriptome coverage allowing a great dynamic range of detection
Rare transcripts can therefore be detected

Where are the exons, where are the UTRS, and what can you determine about the RNA-seq coverage?
The exons are the rectangles on the RefSeq gene coverage. The UTRS are the bigger rectangles on the opposite ends of the line. This tells that the gene is expressed because we have reads mapping back to it, if you look at the RNA-seq read coverage line.
RPKM calculation
Remmeber that transcript length has to be in bp.

What two factors do RPKM normalize by?
Gene length and total amount of reads sequenced. If these two values are changed but the amount of reads sequenced for a set change does not, you can determine if the gene is up-regulated or down-regulated.
Translatome
Complete set of all mRNA molecules getting translated into proteins in a cell/organism at a specific time.
How is translation different in prokaryotes compared to eukaryotes
Prokaryotes have the ability to do transcription and translation at the same time. Prokaryotes can also take advantage of polysomes, which is when multiple ribosomes attach to an mRNA strand at once. Both of these abiltiies allow for much higher efficiency of translation in prokaryotes. Eukaryotes can however use polysomes, but cannot do transcription and translation at the same time.
Steps of Ribo-seq
The translation process is frozen with the agent Cyclohexamide
Polysome is treated with nuclease to degrade all mRNA not protected by the ribosomes
Ribosomes are removed, and leftover mRNA from each ribosomes (should be 28 to 30 bp in length) is sequenced via reverse transcriptase (just like in RNA-seq)
Compared to a reference genome
Advantages of Ribo-seq
Identify the CDS due to high desnity reads at start and stop
Predict protein abundance
Determine the translational rate for a specific gene
When compared with RNA-seq data, translational efficiency can be determined
How can you tell in Ribo-seq that a region is getting translated?
The high abundance of ribosomal footprints between the start and stop codon, compared to the low density before the start codon and after the stop codon.

Explain this graph
Begining peak of the graph represents initiation, where ribosomes are moving slowly and spending a lot of time. Elongation are the kind of divots within the graph, and its when the ribosomes are moving fast. The end of the graph is where termination occurs, and its when the ribosomes are moving slowly again. The number of protected fragments are proportional to the time the ribosome spends at that position.
How is translational efficiency calculated?
(Ribosomal footprints)/(mRNA-seq) = translational efficiency. When plotting a graph of y-axis = ribosomal footprint counts and x-axis = mRNA-seq abundance, the greater the slope of the line, the higher translational efficiency occured.
Why can ribosome footprints decrease in Ribo-seq?
Fewer mRNA strands
Fewer ribosomes per mRNA strand
The role of initiation and elongation
High ribosome occupancy usually reflects a high translation initiation rate for a specific gene (how frequently do ribosomes occupy the 5’ end of the mRNA). If initiation is fast and elongation proceeds smoothly, more ribosomes translate the transcript simulataneously, resulting in more protein.
Explain the ribosomal ratcheting process
The ribosome jumps through every three nucleotides (one codon) along the mRNA. The ribosomes spends a lot of time in the initiation and termination phase, as the initiation is when the ribosomes all start the process of moving through the 3 nucleotides, and the termination is when the ribosome is at the end of those 3 nucleotides. The elongation process is very quick, as such observed ribosomal protected fragments are much smaller in data readings than in initiation and termination