Lecutre 3 & 4 - Visual & Numerical Data Summaries
 Call Kai
 Learn
Learn Practice Test
 Spaced Repetition
 Match
Match Flashcards
 Knowt Play
1/33

There's no tags or description
Looks like no tags are added yet.
Name | Mastery | Learn | Test | Matching | Spaced | Call with Kai | Chat |
|---|
No analytics yet
Send a link to your students to track their progress
34 Terms
bar plot, what and pros and what thing u get from graph
how: count number obsv per category and make bar w correspond height
pro: displays frequency of each category/level of categorical variables
can get “frequency tables”: record totals and category names
proportion = ? and whats the denotation per type of prop
prop = # cases in category / total # cases
prop of observed sample is p-hat (open down)
prop of pop is p, is the true proportion
How do u estimate range from a symmetric bell shaped curve
Range / 6
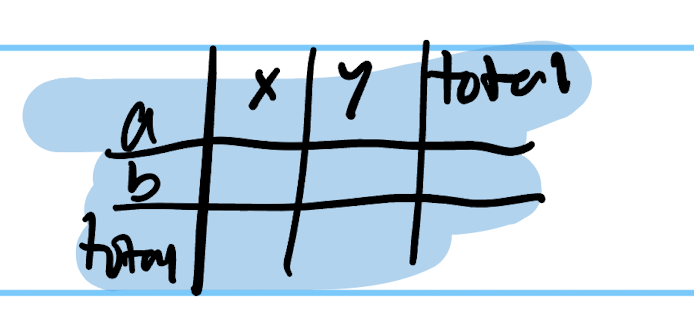
contingency table
variables across rows and columns,
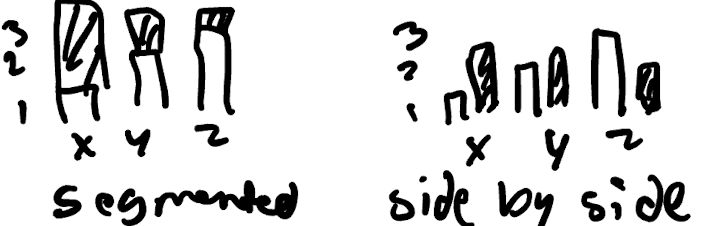
segmented / side by side bar plot, what best for what?
segmented: best to see total numbers and proportions
side by side: best for exact numbers
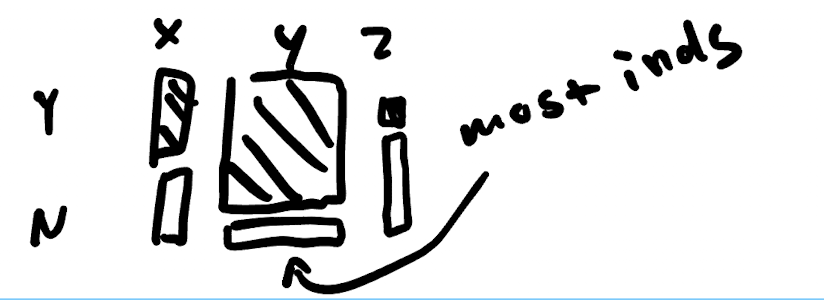
mosaic plot, what can u find with
column width = total number in variable 1
area represents teh proportion of observations per variable
pro: desc relationships between 2 categorical variables
to compare prop see if var are ind, one white line diff level = enough to claim dependent
dot plot
represents each individual as dot along x axis
con: not good for large amt data, not all integer data, data has high range and sparse
histograms
pro: can answer many q’s, can smooth to see shape of dust
con: not show exact values of data, describes shape and density
symmetric and bell shaped histogram
data clustered in middle, equal number higher and lower
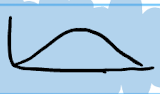
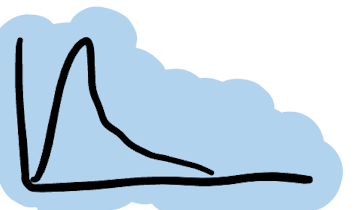
right skewed histogram
most data are smaller values

left skewed histogram
most data are larger values
symmetric and not bell shaped histogram
data values on one side mirror the other
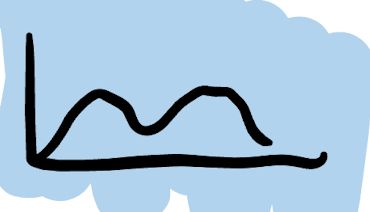
mode, types of modes
mode = hump in graph
unimodal = 1 peak
bimodal = 2 peaks
multimodal = 3+ peaks
uniform = no hump/mode, all bars approx same height
measures of central tendency desc
summarizes data, acknowledges that each data pt may be diff but have a “center” to represent them all together
mean
numerical average value =

median
middle value when data is arranged smallest to largest
n is even → 2 middles, so median is avg of n/2 and (n/2) + 1
n is odd → (n+1)/2
which do u choose between mean and median
choose the one that best represents center/typical values in data set
histograms when is mean=<> median
symmetric, mean=median
right skew, mean>median
left skew, mean<median
spread/variability define
describes how tight/loose the observations in data set are clustered around the measure of central tendency
how to determine outliers
more than upper fence = Q3 + 1.5 * IQR
or
less than lower fence = Q1 - 1.5 * IQR
range = , limitations
maximum value = minimum value, limitations are that it only uses 2 values to describe variation and doesnt always describe smth well
IQR = , how to find each bit
Q3 - Q1, Q1 is median of lower ½ of data, Q3 is median of upper ½ of data
departures from mean, implications, prob and sol
distance of the mean from each observation
larger deviations = more variable data
problems: 1. sum of dev^n is always 0, 2. sum of squares always inc w inc obsv
soln: 1. sum of squares 2. divide SoS by n to find mean squared deviation
population variance = , why not use much?
bc is squared

sample variance = , why not use much?
bc is squared
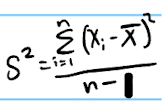
pop standard deviation =

sample standard deviation =

wording for stdev
the variables of the population in our sample are roughly stdev away from the mean variable of xhat on average
what does stdev do
sqrt of variance, describes how close data are to the mean, if s=0 then every data pt is same value
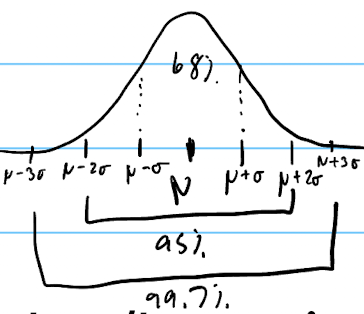
how are stdev and mean related for symmetric bell shaped graphs
mean +-1 stdev = 68% of data
mean +-2 stdev = 95% of data
mean +-3 stdev = 99.7% of data
notation for parameter, mean variance, stdev, pop

notation for statistic, mean variance, stdev, pop

which ones are robust to outliers?
median, IQR
which ones are sensitive to outliers?
mean, stdev, range