Lab Exam 2 Review

0.0(0)
Studied by 0 people
call kaiCall Kai
learnLearn
examPractice Test
spaced repetitionSpaced Repetition
heart puzzleMatch
flashcardsFlashcards
GameKnowt Play
Card Sorting

1/150

flashcard set

Earn XP

Description and Tags

Enzymes- Translation

151 Terms

1
New cards

Enzymes:

  • Enzymes are proteins that work as catalysts

  • As catalysts, enzymes make chemical reactions go faster

  • Enzymes are specific for one type of reaction

  • Enzymes can be used repeatedly

  • Enzyme function depends on its 3-D structure

  • Changes in temperature and pH can alter enzyme structure and function


<ul><li><p><span>Enzymes are proteins that work as catalysts</span></p></li><li><p><span>As catalysts, enzymes make chemical reactions go faster</span></p></li><li><p><span>Enzymes are specific for one type of reaction</span></p></li><li><p><span>Enzymes can be used repeatedly</span></p></li><li><p><span>Enzyme function depends on its 3-D structure</span></p></li><li><p><span>Changes in temperature and pH can alter enzyme structure and function</span></p></li></ul><p></p>
2
New cards

Enzymes overview:

  • Enzymes are proteins that work as catalysts

  • As catalysts, enzymes make chemical reactions go faster

  • Enzymes are specific for one type of reaction

  • Enzymes can be used repeatedly

  • Enzyme function depends on its 3-D structure

  • Changes in temperature and pH can alter enzyme structure and function


<ul><li><p>Enzymes are proteins that work as catalysts</p></li><li><p>As catalysts, enzymes make chemical reactions go faster</p></li><li><p>Enzymes are specific for one type of reaction</p></li><li><p>Enzymes can be used repeatedly</p></li><li><p>Enzyme function depends on its 3-D structure</p></li><li><p>Changes in temperature and pH can alter enzyme structure and function</p></li></ul><p></p>
3
New cards

Enzyme details

Enzymes are catalysts:

  • proteins that speed up reactions by lowering activation energy

  • bind with the reactants

  • are very specific, catalyzing a single type of reaction

  • can be used over and over


4
New cards

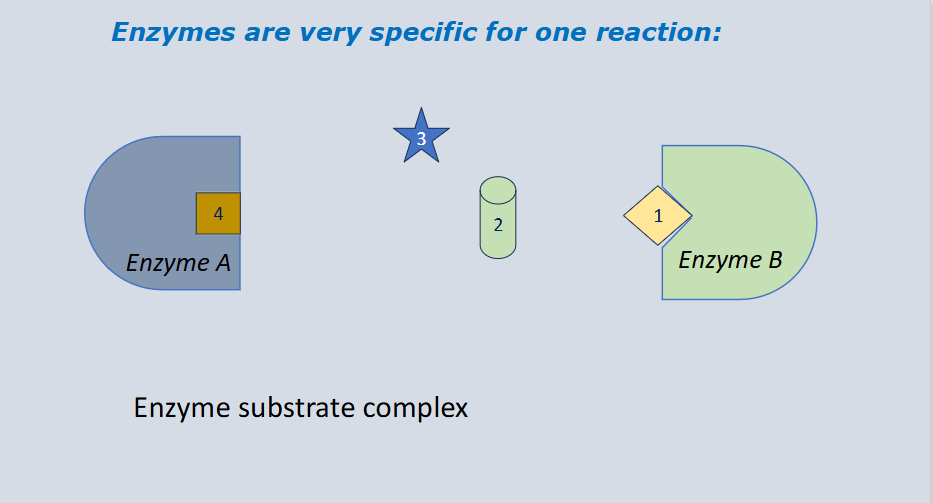
Enzymes are very specific for one reaction:

The property that allows an enzyme to catalyze only one particular chemical reaction—or a small group of closely related reactions—out of thousands of possible cellular processes

  • Shape and Chemical Compatibility: specificity is determined by the unique 3D conformation of the active site, which matches the substrate's shape, charge, and polarity (driven by the interactions of amino acid R-groups)


<p>The property that allows an enzyme to catalyze only one particular chemical reaction—or a small group of closely related reactions—out of thousands of possible cellular processes</p><ul><li><p><strong>Shape and Chemical Compatibility:</strong> specificity is determined by the unique 3D conformation of the active site, which matches the substrate's <strong>shape, charge, and polarity</strong> (driven by the interactions of amino acid R-groups)</p></li></ul><p></p>
5
New cards

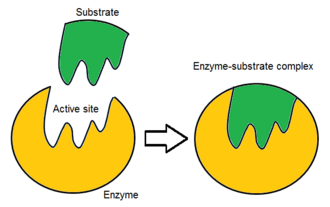
Enzyme-substrate complex

The temporary, transitional molecular structure that forms when an enzyme binds to its specific reactant (substrate) at its active site

  • the temporary intermediate molecule formed when an enzyme binds to its substrate (reactant) at the active site

  • Enzyme + Substrate ←→ [Enzyme-Substrate complex] → Enzyme + Product(s)

<p>The temporary, transitional molecular structure that forms when an enzyme binds to its specific reactant (substrate) at its active site</p><ul><li><p>the temporary intermediate molecule formed when an enzyme binds to its substrate (reactant) at the active site</p></li><li><p>Enzyme + Substrate ←→ [Enzyme-Substrate complex] → Enzyme + Product(s)</p></li></ul><p></p>
6
New cards

Enzymes lower the activation energy of a chemical reaction

An enzyme is a biological catalyst (typically a globular protein or ribozyme) that lowers the activation energy of a chemical reaction, accelerating the reaction rate without being consumed or permanently altered

  • An enzyme lowers activation energy by providing an alternative reaction pathway that reduces the energy barrier reactants must overcome to reach the transition state


<p><span>An </span>enzyme is a biological catalyst (typically a globular protein or ribozyme) that lowers the activation energy of a chemical reaction, accelerating the reaction rate without being consumed or permanently altered</p><ul><li><p><span>An enzyme lowers activation energy by </span>providing an alternative reaction pathway that reduces the energy barrier reactants must overcome to reach the transition state</p></li></ul><p></p>
7
New cards

Activation energy

The minimum amount of energy required to start a chemical reaction (often compared to the initial push needed to get a boulder rolling down a hill)

  • In cells, it represents the energy barrier that reactant molecules must overcome to reach a high-energy, unstable transition state where bonds break and reform

  • the amount of initial energy necessary for reactions to occur


<p>The minimum amount of energy required to start a chemical reaction (often compared to the initial push needed to get a boulder rolling down a hill)</p><ul><li><p>In cells, it represents the energy barrier that reactant molecules must overcome to reach a high-energy, unstable <strong>transition state</strong> where bonds break and reform</p></li><li><p><span>the amount of initial energy necessary for reactions to occur</span><br></p></li></ul><p></p>
8
New cards

Substrate

The specific reactant molecule that binds to an enzyme’s active site and is chemically converted into a product

  • the specific reactant molecule that binds to an enzyme's active site and is converted into a product

  • a molecule on which the enzyme acts


<p>The specific reactant molecule that binds to an enzyme’s active site and is chemically converted into a product</p><ul><li><p>the specific reactant molecule that binds to an enzyme's active site and is converted into a product</p></li><li><p><span>a molecule on which the enzyme acts</span><br></p></li></ul><p></p>
9
New cards

Active site

The specific region on the surface of an enzyme—usually a small pocket or groove—where substrate molecules bind and a chemical reaction takes place

  • the specific region on an enzyme where a substrate binds and the chemical reaction takes place

  • part of enzyme where reaction takes place; its specific for each reactant

<p>The specific region on the surface of an enzyme—usually a small pocket or groove—where substrate molecules bind and a chemical reaction takes place</p><ul><li><p>the specific region on an enzyme where a <strong>substrate</strong> binds and the chemical reaction takes place</p></li><li><p><span>part of enzyme where reaction takes place; its specific for each reactant</span></p></li></ul><p></p>
10
New cards

Transition state

The highest-energy, unstable configuration of atoms that occurs during a chemical reaction, representing the peak of the energy barrier (the "tipping point") between reactants and products

  • the temporary, unstable high-energy state during a chemical reaction where old covalent bonds are breaking and new bonds are forming


<p>The highest-energy, unstable configuration of atoms that occurs during a chemical reaction, representing the peak of the energy barrier (the "tipping point") between reactants and products</p><ul><li><p>the temporary, unstable high-energy state during a chemical reaction where old covalent bonds are breaking and new bonds are forming</p></li></ul><p></p>
11
New cards

Gibbs free energy (G)

The measure of usable energy in a system that is available to perform work at constant temperature and pressure, after accounting for energy lost as entropy

  • energy that is available to do work (not total energy). The change in G after a reaction = ∆G

  • amount of energy available to do work (usable
    energy)

  • ΔG = ΔH − TΔS


<p>The measure of usable energy in a system that is available to perform work at constant temperature and pressure, after accounting for energy lost as entropy</p><ul><li><p><span>energy that is available to do work (not total energy). The change in G after a reaction = ∆G</span></p></li><li><p><span>amount of energy available to do work (usable</span><br><span>energy)</span></p></li><li><p><span>ΔG = ΔH − TΔS</span></p></li></ul><p></p>
12
New cards

Exergonic reaction

A chemical reaction that results in products with less chemical potential energy than the reactants (energy is released; -∆G)

  • a chemical reaction that releases free energy

  • Gibbs Free Energy (-∆G): Negative Delta G < 0. The products have less potential energy than the reactants


<p><span>A chemical reaction that results in products with less chemical potential energy than the reactants (energy is released; -∆G)</span></p><ul><li><p>a chemical reaction that releases free energy</p></li></ul><ul><li><p><strong>Gibbs Free Energy (-∆G):</strong> Negative Delta G &lt; 0. The products have <strong>less potential energy</strong> than the reactants</p></li></ul><p></p>
13
New cards

Endergonic reaction

A chemical reaction that results in products that store more chemical potential energy than the reactants (energy is added; +∆G):

  • Gibbs Free Energy: endergonic reactions have a positive Delta G > 0. The products contain more free energy than the reactants

  • a chemical reaction that absorbs free energy from its surroundings
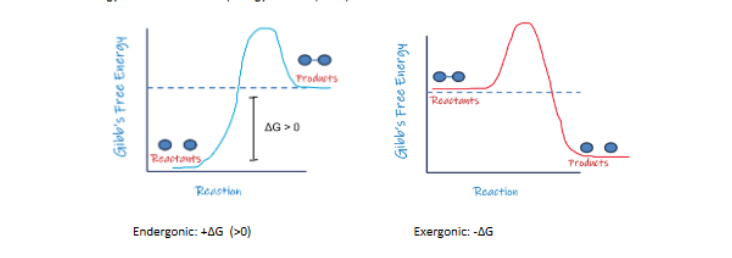

<p><span>A chemical reaction that results in products that store more chemical potential energy than the reactants (energy is added; +∆G):</span></p><ul><li><p><strong>Gibbs Free Energy:</strong> endergonic reactions have a <strong>positive Delta G &gt; 0.</strong> The products contain more free energy than the reactants</p></li><li><p>a chemical reaction that absorbs free energy from its surroundings</p></li></ul><p></p>
14
New cards

How enzymes lower activation energy:

How enzymes lower activation energy:

  • align the substrates perfectly for the reaction

  • provide an optimal environment, i.e. acidic or polar, within the active site for the reaction

  • contorts/stresses the substrate so it is less stable and more likely to react

  • temporarily react with the substrate (chemically change it) making the substrate less stable and more likely to react


15
New cards

How do enzymes lower activation energy?

How enzymes lower activation energy:

  • align the substrates perfectly for the reaction

  • provide an optimal environment, i.e. acidic or polar, within the active site for the reaction

  • contorts/stresses the substrate so it is less stable and more likely to react

  • temporarily react with the substrate (chemically change it) making the substrate less stable and
    more likely to react


16
New cards

How can you speed up the reaction rate?

  1. Add a Catalyst (Enzymes): enzymes are biological catalysts that lower the activation energy of a reaction. They do not change the free energy of the reactants or products

  2. Increase Substrate Concentration

  3. Increase Enzyme Concentration

  4. Optimize Temperature

  5. Optimize pH


17
New cards

How can you speed up the reaction rate?

  1. Add a Catalyst (Enzymes): enzymes are biological catalysts that lower the activation energy of a reaction. They do not change the free energy of the reactants or products

  2. Increase Substrate Concentration

  3. Increase Enzyme Concentration

  4. Optimize Temperature

  5. Optimize pH


18
New cards

Induced fit

When enzyme binds the substrate, the enzyme undergoes a small conformational change (like enzyme hugging the substrate)

19
New cards

Enzymes have an optimal range in temperature and pH

Enzymes have an optimal pH and temperature

  • Enzyme function can be altered by changes in
    temperature and/or pH

  • Enzymes lose their structure (become denatured) when exposed to drastic changes in temperature or pH


<p><span>Enzymes have an optimal pH and temperature</span></p><ul><li><p><span>Enzyme function can be altered by changes in</span><br><span>temperature and/or pH</span></p></li><li><p><span>Enzymes lose their structure (become denatured) when exposed to drastic changes in temperature or pH</span></p></li></ul><p></p>
20
New cards

Enzyme function can be affected by inhibitors

  • Competitive inhibitors have a similar shape to the substrate and compete with the substrate for the active site

  • Non-competitive inhibitors bind to the enzyme at a different location (allosteric site) but affect shape of active site. This causes a slower reaction rate and a slower maximal rate


<ul><li><p><span>Competitive inhibitors have a similar shape to the substrate and compete with the substrate for the active site</span></p></li><li><p><span>Non-competitive inhibitors bind to the enzyme at a different location (allosteric site) but affect shape of active site. This causes a slower reaction rate and a slower maximal rate</span><br></p></li></ul><p></p>
21
New cards

Chemical reaction graph

  • Yellow arrow: activation energy without an enzyme

  • Green arrow: activation energy with enzyme; enzyme catalyzes the reaction by lowering the activation energy barrier, allowing the reaction to proceed much faster

  • Orange arrow: gibbs free energy (∆G); it measures the difference in Gibbs free energy between the reactants and products

  • This particular reaction is exergonic

  • Enzymes lower the activation energy of a chemical reaction


<ul><li><p>Yellow arrow: activation energy without an enzyme</p></li><li><p>Green arrow: activation energy with enzyme; enzyme catalyzes the reaction by lowering the activation energy barrier, allowing the reaction to proceed much faster</p></li><li><p>Orange arrow: gibbs free energy (∆G); it measures the difference in Gibbs free energy between the reactants and products </p></li><li><p>This particular reaction is exergonic</p></li><li><p>Enzymes lower the activation energy of a chemical reaction</p></li></ul><p></p>
22
New cards

Chemical reaction graph

  • Yellow arrow: activation energy without an enzyme

  • Green arrow: activation energy with enzyme; enzyme catalyzes the reaction by lowering the activation energy barrier, allowing the reaction to proceed much faster

  • Orange arrow: gibbs free energy (∆G); it measures the difference in Gibbs free energy between the reactants and products

  • This particular reaction is exergonic

  • Enzymes lower the activation energy of a chemical reaction


<ul><li><p>Yellow arrow: activation energy without an enzyme</p></li><li><p>Green arrow: activation energy with enzyme; enzyme catalyzes the reaction by lowering the activation energy barrier, allowing the reaction to proceed much faster</p></li><li><p>Orange arrow: gibbs free energy (∆G); it measures the difference in Gibbs free energy between the reactants and products </p></li><li><p>This particular reaction is exergonic</p></li><li><p>Enzymes lower the activation energy of a chemical reaction</p></li></ul><p></p>
23
New cards

Enzyme function depends on its 3D structure

An enzyme's ability to catalyze chemical reactions relies directly on its three-dimensional (3D) tertiary or quaternary structure

  • Weak bonds (hydrogen bonds, ionic bonds, and hydrophobic interactions) maintain the enzyme's folded shape

  • If environmental factors—like extreme temperature or improper pH—shift too far from the enzyme's optimum, these weak bonds break. The enzyme unfolds and loses its shape (denatures), making it unable to bind substrates or catalyze reactions


<p><span>An enzyme's ability to catalyze chemical reactions relies directly on its </span>three-dimensional (3D) tertiary or quaternary structure</p><ul><li><p>Weak bonds (hydrogen bonds, ionic bonds, and hydrophobic interactions) maintain the enzyme's folded shape</p></li><li><p>If environmental factors—like <strong>extreme temperature</strong> or <strong>improper pH</strong>—shift too far from the enzyme's optimum, these weak bonds break. The enzyme unfolds and loses its shape (<strong>denatures</strong>), making it unable to bind substrates or catalyze reactions</p></li></ul><p></p>
24
New cards

What types of bonds maintain an enzymes 3D structure?

  • Hydrogen bonds

  • Ionic bonds (electrostatic attractions)

  • Hydrophobic interactions

  • Disulfide bridges: Strong covalent bonds that form between the sulfur-containing R-groups of two cysteine amino acids.


25
New cards

Functional enzyme

A functional enzyme is a biologically active protein that maintains its proper three-dimensional shape, allowing its active site to bind substrates and catalyze chemical reactions

  • has 3D structure and active site

  • Function: lowers the activation energy of a specific biochemical reaction and converts substrates into products without being consumed.

  • Conditions: operates within its optimal temperature and pH range


<p><span>A </span><strong>functional enzyme</strong> is a biologically active protein that maintains its proper three-dimensional shape, allowing its active site to bind substrates and catalyze chemical reactions</p><ul><li><p><span>has 3D structure and active site</span></p></li><li><p><span><strong>Function:</strong> lowers the activation energy of a specific biochemical reaction and converts substrates into products without being consumed.</span></p></li><li><p><span><strong>Conditions:</strong> operates within its optimal temperature and pH range</span></p></li></ul><p></p>
26
New cards

Causes of denaturation

  • High temperature: extreme temperatures (high heat) breaks bonds: It disrupts weak non-covalent interactions, primarily hydrogen bonds and hydrophobic interactions

  • Δ pH: a sudden surplus of hydrogen ions (H+) or hydroxide ions (OH-) alters the electric charges of amino acid side chains (R-groups), disrupting ionic bonds and hydrogen bonds that hold the folded 3D shape together

  • Δ Salt (high salt)

  • Cold temperatures do not denature enzymes; they merely slow molecular motion until warmed back up


<ul><li><p><span>High temperature: </span>extreme temperatures (high heat) breaks bonds<strong>:</strong> It disrupts weak non-covalent interactions, primarily <strong>hydrogen bonds</strong> and <strong>hydrophobic interactions</strong></p></li><li><p><span>Δ pH: a sudden surplus of hydrogen ions (H+) or hydroxide ions (OH-) alters the electric charges of amino acid side chains (R-groups), disrupting <strong>ionic bonds</strong> and <strong>hydrogen bonds</strong> that hold the folded 3D shape together</span></p></li><li><p><span>Δ Salt (high salt)</span></p></li><li><p><strong>Cold temperatures do not denature enzymes</strong>; they merely slow molecular motion until warmed back up</p></li></ul><p></p>
27
New cards

Causes of denaturation

  • High temperature: extreme temperatures (high heat) breaks bonds: It disrupts weak non-covalent interactions, primarily hydrogen bonds and hydrophobic interactions

  • pH: a sudden surplus of hydrogen ions (H+) or hydroxide ions (OH-) alters the electric charges of amino acid side chains (R-groups), disrupting ionic bonds and hydrogen bonds that hold the folded 3D shape together

  • Salt (high salt)

  • Cold temperatures do not denature enzymes; they merely slow molecular motion until warmed back up


<ul><li><p>High temperature: extreme temperatures (high heat) breaks bonds<strong>:</strong> It disrupts weak non-covalent interactions, primarily <strong>hydrogen bonds</strong> and <strong>hydrophobic interactions</strong></p></li><li><p>pH: a sudden surplus of hydrogen ions (H+) or hydroxide ions (OH-) alters the electric charges of amino acid side chains (R-groups), disrupting <strong>ionic bonds</strong> and <strong>hydrogen bonds</strong> that hold the folded 3D shape together</p></li><li><p>Salt (high salt)</p></li><li><p><strong>Cold temperatures do not denature enzymes</strong>; they merely slow molecular motion until warmed back up</p></li></ul><p></p>
28
New cards

Main causes of denaturation

  • Extreme temperatures (high heat)

  • Extreme pH (surplus of H+ or OH- ions)

  • Salt (high salt concentration)

  • Cold temperatures do not denature enzymes; they merely slow molecular motion until warmed back up
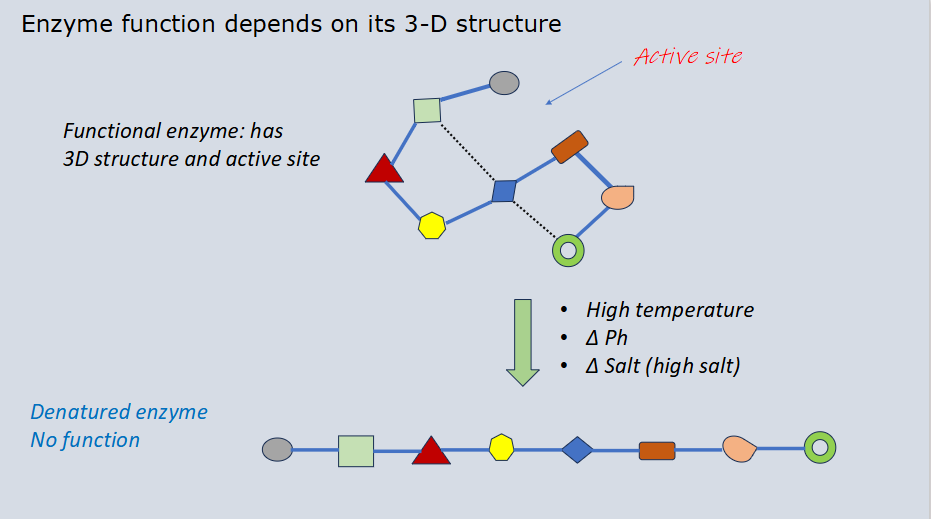

<ul><li><p>Extreme temperatures (high heat)</p></li><li><p>Extreme pH (surplus of H+ or OH- ions)</p></li><li><p>Salt (high salt concentration)</p></li><li><p><strong>Cold temperatures do not denature enzymes</strong>; they merely slow molecular motion until warmed back up</p></li></ul><p></p>
29
New cards

Denatured enzyme

An enzyme that has lost its functional three-dimensional shape (its tertiary or quaternary structure) due to environmental stress, causing it to lose its ability to catalyze chemical reactions

  • Bond breakdown: disrupted forces include hydrogen bonds, ionic bonds, and hydrophobic interactions.

  • Primary structure is kept: covalent peptide bonds that link amino acids together remain intact; the protein chain itself is not destroyed

  • The shape of the active site changes so the substrate no longer fits ("key-in-lock" mismatch), stopping catalysis


<p>An enzyme that has lost its functional three-dimensional shape (its tertiary or quaternary structure) due to environmental stress, causing it to lose its ability to catalyze chemical reactions</p><ul><li><p><strong>Bond breakdown:</strong> disrupted forces include hydrogen bonds, ionic bonds, and hydrophobic interactions.</p></li><li><p><strong>Primary structure is kept:</strong> covalent <strong>peptide bonds</strong> that link amino acids together remain intact; the protein chain itself is not destroyed</p></li><li><p>The shape of the active site changes so the substrate no longer fits ("key-in-lock" mismatch), stopping catalysis</p></li></ul><p></p>
30
New cards

Denaturation

The process where a protein loses its functional three-dimensional shape (its tertiary and secondary structures) because environmental stress breaks the weak bonds holding it together

  • Denatured enzyme = no function

  • Hydrogen bonds, ionic bonds, and hydrophobic interactions unravel

  • The primary structure (the covalent peptide bond sequence of amino acids) does not break (stays intact)


<p>The process where a protein loses its functional three-dimensional shape (its tertiary and secondary structures) because environmental stress breaks the weak bonds holding it together</p><ul><li><p><span>Denatured enzyme = no function</span></p></li><li><p><span>Hydrogen bonds, ionic bonds, and hydrophobic interactions unravel</span></p></li><li><p><span>The <strong>primary structure</strong> (the covalent peptide bond sequence of amino acids) does <em>not</em> break (stays intact)</span></p></li></ul><p></p>
31
New cards

Catalase

A common biological enzyme studied in a catalysis lab that speeds up the breakdown of toxic hydrogen peroxide (H₂O₂) into harmless water (H₂O) and oxygen gas (O₂)

  • the primary function of catalase is to speed up the breakdown of hydrogen peroxide (H₂O₂) a toxic byproduct of cellular respiration, into harmless water (H2O) and oxygen gas (O₂)

  • the Enzyme Catalase breaks down Hydrogen Peroxide


<p>A common biological enzyme studied in a catalysis lab that speeds up the breakdown of toxic hydrogen peroxide (H₂O₂) into harmless water (H₂O) and oxygen gas (O₂)</p><ul><li><p>the primary function of catalase is to speed up the breakdown of hydrogen peroxide (H₂O₂) a toxic byproduct of cellular respiration, into harmless water (H2O) and oxygen gas (O₂)</p></li><li><p><span>the Enzyme Catalase breaks down Hydrogen Peroxide</span></p></li></ul><p></p>
32
New cards

Catalase-catalyzed reaction

Catalase is a protein enzyme that speeds up the decomposition (breakdown) of toxic hydrogen peroxide into harmless water and oxygen gas

  • Reactants/substrate: hydrogen peroxide (H₂O₂)

  • Products: water (H₂O) and oxygen gas (O₂)

  • Enzyme: catalase (sourced from chicken liver or potatoes)

  • H₂O₂ → H₂O + O₂


<p>Catalase is a protein enzyme that speeds up the decomposition (breakdown) of toxic hydrogen peroxide into harmless water and oxygen gas</p><ul><li><p>Reactants/substrate: hydrogen peroxide (H₂O₂)</p></li><li><p>Products: water (H₂O) and oxygen gas (O₂)</p></li><li><p>Enzyme: catalase (sourced from chicken liver or potatoes)</p></li><li><p>H₂O₂ → H₂O + O₂</p></li></ul><p></p>
33
New cards

Positive reaction for catalase

You see immediate bubbling or foaming. This happens because catalase successfully broke down toxic hydrogen peroxide (H₂O₂) into harmless water (H₂O) and oxygen gas (O₂)

  • It worked: you will see immediate, active bubbling or fizzing, meaning catalase successfully broke down the substrate into oxygen gas

  • If oxygen forms visible bubbles at the surface

  • Enzyme: catalase, an enzyme produced by many animal, plant, and bacterial cells


<p><span>You see <strong>immediate bubbling or foaming</strong>. This happens because catalase successfully broke down toxic hydrogen peroxide <strong>(H₂O₂) </strong>into harmless water <strong>(H₂O) </strong>and oxygen gas <strong>(O₂)</strong></span></p><ul><li><p><span><strong>It worked:</strong> you will see immediate, active <strong>bubbling or fizzing</strong>, meaning catalase successfully broke down the substrate into oxygen gas</span></p></li><li><p><span style="line-height: 150%;">If oxygen forms visible bubbles at the surface</span></p></li><li><p class="MsoListParagraphCxSpLast"><span style="line-height: 150%;">Enzyme: catalase, an enzyme produced by many animal, plant, and bacterial cells</span></p></li></ul><p></p>
34
New cards

Negative reaction for catalase

It did not work (Negative Reaction): there is no bubbling at all. This means the catalase was either missing, inactive, or denatured (unraveled) by high heat or extreme pH, preventing it from breaking down the hydrogen peroxide

  • the solution will remain completely still with no bubbles, meaning the enzyme was either denatured (by heat or extreme pH) or missing entirely

  • you can determine if a catalase reaction has worked by looking for the production of oxygen gas, which appears as bubbling or foaming


35
New cards

Testing effect of hydrogen peroxide concentration on enzyme activity

Catalase is an enzyme that breaks down toxic hydrogen peroxide (H2O2) into water (H2O) and oxygen gas (O2)

  • Changing the concentration of hydrogen peroxide (the substrate) changes the rate of the reaction

  • Lower Concentrations: fewer substrate molecules mean fewer collisions between hydrogen peroxide and the active sites of the catalase enzyme, resulting in a slower reaction rate (fewer bubbles or foam)

  • Increasing Concentrations: Adding more hydrogen peroxide increases the frequency of effective collisions between the enzyme and substrate, causing the reaction rate to increase

  • However, there is a limit. If you keep adding even more hydrogen peroxide (e.g, creating a tube 7) the reaction rate would eventually level off and stop increasing
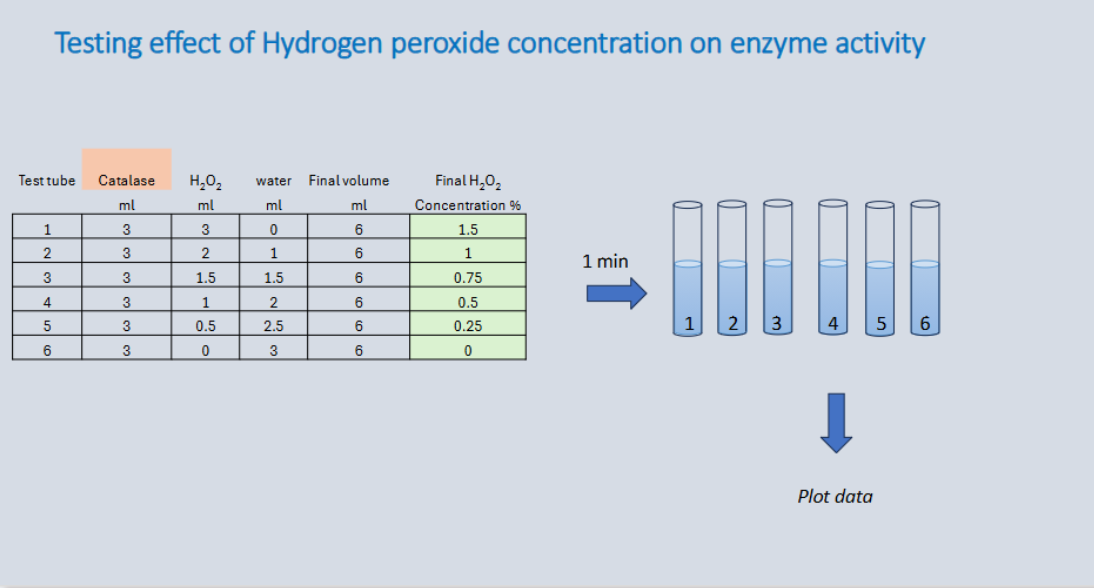

<p><strong>Catalase</strong> is an enzyme that breaks down toxic hydrogen peroxide (H2O2) into water (H2O) and oxygen gas (O2)</p><ul><li><p>Changing the concentration of hydrogen peroxide (the substrate) changes the rate of the reaction</p></li></ul><ul><li><p><span><strong>Lower Concentrations:</strong> fewer substrate molecules mean fewer collisions between hydrogen peroxide and the active sites of the catalase enzyme, resulting in a <strong>slower reaction rate</strong> (fewer bubbles or foam)</span></p></li><li><p><span><strong>Increasing Concentrations:</strong> Adding more hydrogen peroxide increases the frequency of effective collisions between the enzyme and substrate, causing the <strong>reaction rate to increase</strong></span></p></li><li><p>However, there is a limit. If you keep adding even more hydrogen peroxide (e.g, creating a tube 7) the reaction rate would eventually level off and stop increasing</p></li></ul><p></p>
36
New cards

Testing effect of hydrogen peroxide concentration on enzyme activity

Changing the concentration of hydrogen peroxide (the substrate) changes the rate of the reaction

  • Lower Concentrations: fewer substrate molecules mean fewer collisions between hydrogen peroxide and the active sites of the catalase enzyme, resulting in a slower reaction rate (fewer bubbles or foam)

  • Increasing Concentrations: Adding more hydrogen peroxide increases the frequency of effective collisions between the enzyme and substrate, causing the reaction rate to increase

  • Tube 1- represents the highest reaction rate due to maximum substrate concentration

  • Tube 2-4: reaction rate gets slower due to decreasing substrate concentration

  • Tube 5 (slowest active rate): minimal reaction rate due to lowest substrate concentration

  • Tube 6 (zero/no reaction): has a reaction rate of 0 because there is no substrate to break down


<p>Changing the concentration of hydrogen peroxide (the substrate) changes the rate of the reaction</p><ul><li><p><strong>Lower Concentrations:</strong> fewer substrate molecules mean fewer collisions between hydrogen peroxide and the active sites of the catalase enzyme, resulting in a <strong>slower reaction rate</strong> (fewer bubbles or foam)</p></li><li><p><strong>Increasing Concentrations:</strong> Adding more hydrogen peroxide increases the frequency of effective collisions between the enzyme and substrate, causing the <strong>reaction rate to increase</strong></p></li><li><p>Tube 1- represents the highest reaction rate due to maximum substrate concentration</p></li><li><p>Tube 2-4: reaction rate gets slower due to decreasing substrate concentration</p></li><li><p>Tube 5 (slowest active rate): minimal reaction rate due to lowest substrate concentration</p></li><li><p>Tube 6 (zero/no reaction): has a reaction rate of 0 because there is no substrate to break down</p></li></ul><p></p>
37
New cards

Effect of hydrogen peroxide concentration on enzyme (catalase) activity

Changing the concentration of hydrogen peroxide (the substrate) changes the rate of the reaction

  • Lower Concentrations: fewer substrate molecules mean fewer collisions between hydrogen peroxide and the active sites of the catalase enzyme, resulting in a slower reaction rate (fewer bubbles or foam)

  • Increasing Concentrations: Adding more hydrogen peroxide increases the frequency of effective collisions between the enzyme and substrate, causing the reaction rate to increase

  • Tube 1- represents the highest reaction rate due to maximum substrate concentration

  • Tube 2-4: reaction rate gets slower due to decreasing substrate concentration

  • Tube 5 (slowest active rate): minimal reaction rate due to lowest substrate concentration

  • Tube 6 (zero/no reaction): has a reaction rate of 0 because there is no substrate to break down
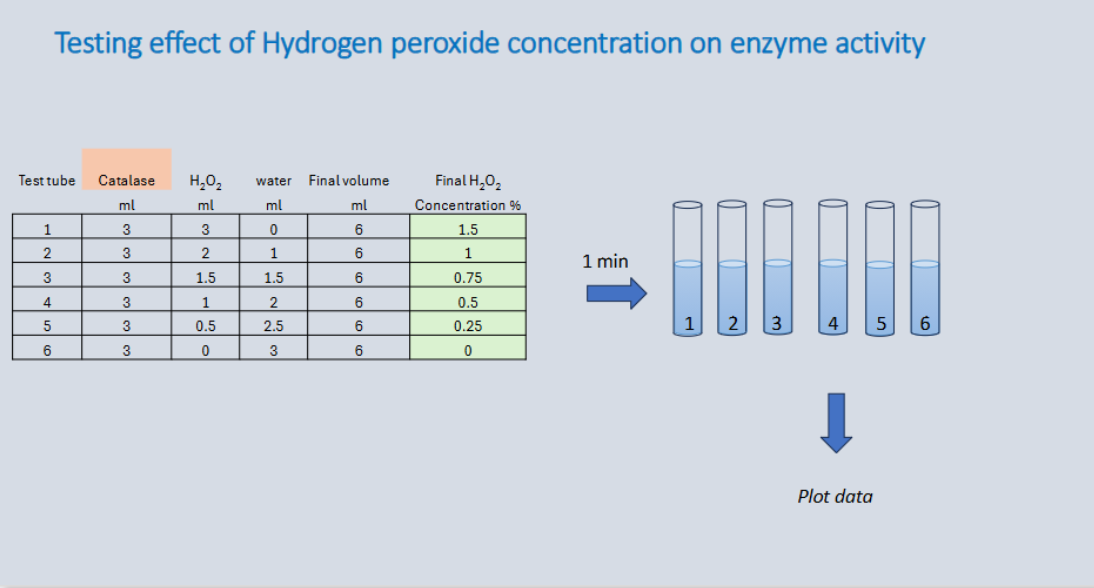

<p>Changing the concentration of hydrogen peroxide (the substrate) changes the rate of the reaction</p><ul><li><p><strong>Lower Concentrations:</strong> fewer substrate molecules mean fewer collisions between hydrogen peroxide and the active sites of the catalase enzyme, resulting in a <strong>slower reaction rate</strong> (fewer bubbles or foam)</p></li><li><p><strong>Increasing Concentrations:</strong> Adding more hydrogen peroxide increases the frequency of effective collisions between the enzyme and substrate, causing the <strong>reaction rate to increase</strong></p></li><li><p>Tube 1- represents the highest reaction rate due to maximum substrate concentration</p></li><li><p>Tube 2-4: reaction rate gets slower due to decreasing substrate concentration</p></li><li><p>Tube 5 (slowest active rate): minimal reaction rate due to lowest substrate concentration</p></li><li><p>Tube 6 (zero/no reaction): has a reaction rate of 0 because there is no substrate to break down</p></li></ul><p></p>
38
New cards

Effect of hydrogen peroxide concentration on catalase activity

Increasing the concentration of hydrogen peroxide (H2O2) raises the rate of the catalase-catalyzed reaction up to a specific threshold, after which the reaction rate plateaus

  • Adding more hydrogen peroxide increases the collision frequency between the substrate and the enzyme, rapidly increasing the reaction rate (measured via oxygen bubble production

  • Eventually, a point is reached where all catalase active sites are continuously occupied (saturated) with hydrogen peroxide (H2O2) molecules

  • Further increasing the concentration of hydrogen peroxide will no longer increase the reaction rate, as the enzymes are working at their maximum capacity


<p><span>Increasing the concentration of hydrogen peroxide (</span>H2O2) raises the rate of the catalase-catalyzed reaction up to a specific threshold, after which the reaction rate plateaus</p><ul><li><p>Adding more hydrogen peroxide increases the collision frequency between the substrate and the enzyme, rapidly increasing the reaction rate (measured via oxygen bubble production</p></li><li><p><span>Eventually, a point is reached where all catalase active sites are continuously occupied (saturated) with hydrogen peroxide (H2O2) molecules</span></p></li><li><p><span>Further increasing the concentration of hydrogen peroxide will no longer increase the reaction rate, as the enzymes are working at their maximum capacity</span></p></li></ul><p></p>
39
New cards

Types of Respiration

Cellular respiration is divided into two primary types based on the presence of oxygen (O2): aerobic respiration and anaerobic respiration (which includes fermentation)

  • Cellular respiration: oxygen is present/required (aerobic process)

  • Fermentation: oxygen is absent (anaerobic process)


<p>Cellular respiration is divided into two primary types based on the presence of oxygen (O2): aerobic respiration and anaerobic respiration (which includes fermentation)</p><ul><li><p>Cellular respiration: oxygen is present/required (aerobic process)</p></li><li><p>Fermentation: oxygen is absent (anaerobic process)</p></li></ul><p></p>
40
New cards

Aerobic cellular respiration

The oxygen-requiring metabolic pathway that breaks down organic molecules (such as glucose) to produce usable cellular energy in the form of ATP (adenosine triphosphate)

  • 4 stages

  • O2 required (final electron acceptor)

  • Inputs: glucose + oxygen

  • Outputs: carbon dioxide , water, and ATP (around 30-32)


<p>The oxygen-requiring metabolic pathway that breaks down organic molecules (such as glucose) to produce usable cellular energy in the form of ATP (adenosine triphosphate)</p><ul><li><p>4 stages</p></li><li><p>O2 required (final electron acceptor)</p></li><li><p>Inputs: glucose + oxygen</p></li><li><p>Outputs: carbon dioxide , water, and ATP (around 30-32)</p></li></ul><p></p>
41
New cards

Aerobic cellular respiration inputs/outputs

Inputs:

  • Glucose (C6H12O6)

  • Oxygen (O2) - required as the final electron acceptor (aerobic)


Outputs:

  • Carbon dioxide (CO2)

  • Water (H2O)

  • ATP (energy) around 30-32 or 36


<p><strong>Inputs:</strong></p><ul><li><p>Glucose (C6H12O6)</p></li><li><p>Oxygen (O2) - required as the final electron acceptor (aerobic)</p></li></ul><p></p><p><strong>Outputs:</strong></p><ul><li><p>Carbon dioxide (CO2)</p></li><li><p>Water (H2O)</p></li><li><p>ATP (energy) around 30-32 or 36</p></li></ul><p></p>
42
New cards

Fermentation

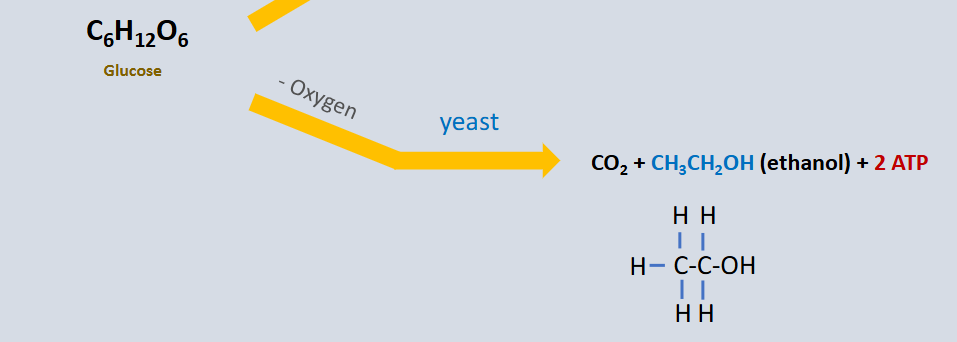
An anaerobic (oxygen-free) metabolic process that allows cells to continue producing a small amount of ATP (2 net ATP per glucose molecule) through glycolysis by regenerating NAD+ from NADH

  • It only yields 2 ATP (via substrate-level phosphorylation in glycolysis), which is far less efficient than aerobic cellular respiration (which yields ~32–38 ATP)

  • It always begins with glycolysis (converting glucose into pyruvate)

  • Then undergoes additional reactions which regenerate NAD+

Two types

  • Lactic acid fermentation

  • Alcohol fermentation


<p>An anaerobic (oxygen-free) metabolic process that allows cells to continue producing a small amount of ATP (2 net ATP per glucose molecule) through glycolysis by regenerating NAD+ from NADH</p><ul><li><p>It only yields <strong>2 ATP</strong> (via substrate-level phosphorylation in glycolysis), which is far less efficient than aerobic cellular respiration (which yields ~32–38 ATP)</p></li><li><p>It always begins with <strong>glycolysis</strong> (converting glucose into pyruvate)</p></li><li><p>Then undergoes additional reactions which regenerate NAD+</p></li></ul><p><strong>Two types</strong></p><ul><li><p>Lactic acid fermentation</p></li><li><p>Alcohol fermentation</p></li></ul><p></p>
43
New cards

Types of fermentation

  • Lactic acid fermentation: pyruvate accepts electrons directly from NADH, producing lactate (or lactic acid) and NAD+

  • Alcohol fermentation: pyruvate is converted into acetaldehyde (releasing CO2), and then NADH transfers its electrons to form ethanol and NAD+


44
New cards

Lactic acid fermentation

Occurs in muscle cells when O2 is low, mammilian red blood cells, and some bacteria (ex, those in yogurt)

  • This reaction is catalyzed by lactate dehydrogenase

  • Pyruvate + NADH → lactate (lactic acid) + NAD+

  • an anaerobic cellular process where pyruvate (from glycolysis) accepts electrons directly from NADH, reducing pyruvate to lactate and oxidizing NADH back to NAD+


45
New cards

Alcohol fermentation

Anaerobic yeast species

Involves two reactions

  • First, catalyzed by pyruvate decarboxylase

  • Second, catalyzed by alcohol dehydrogenase

  • Pyruvate → CO2 + acetylaldehyde

  • acetylaldehyde + NADH → ethanol + NAD+

  • an anaerobic metabolic pathway (occurring without oxygen) used by yeasts and some bacteria to convert sugars into ethanol and carbon dioxide (CO2) while regenerating NAD+


46
New cards

Lactic acid fermentation inputs/outputs

Anaerobic (oxygen-free) process that occurs in muscle cells when O2 is low, mammilian red blood cells, & some bacteria (ex; those in yogurt)

Inputs:

  • Glucose (C6H12O6)

Outputs:

  • Lactic acid (C3H6O3) or lactate

  • Water (H2O)

  • 2 ATP


<p>Anaerobic (oxygen-free) process that occurs in muscle cells when O2 is low, mammilian red blood cells, &amp; some bacteria (ex; those in yogurt)</p><p><strong>Inputs:</strong></p><ul><li><p>Glucose (C6H12O6)</p></li></ul><p><strong>Outputs:</strong></p><ul><li><p>Lactic acid (C3H6O3) or lactate </p></li><li><p>Water (H2O)</p></li><li><p>2 ATP </p></li></ul><p></p>
47
New cards

Alcohol fermentation inputs/outputs

Anaerobic process (oxygen-free) that occurs in anaerobic yeast species

Inputs:

  • Glucose (C6H12O6)

Outputs:

  • Carbon dioxide (CO2)

  • Ethanol (CH3CH2OH)

  • 2 ATP


<p>Anaerobic process (oxygen-free) that occurs in anaerobic yeast species</p><p><strong>Inputs:</strong></p><ul><li><p>Glucose (C6H12O6)</p></li></ul><p><strong>Outputs:</strong></p><ul><li><p>Carbon dioxide (CO2)</p></li><li><p>Ethanol (CH3CH2OH)</p></li><li><p>2 ATP</p></li></ul><p></p>
48
New cards

Inhibition of fermentation

Sodium fluoride (NaF) acts as a competitive or non-competitive inhibitor of glycolysis (specifically targeting the enzyme enolase), which prevents the production of pyruvate and subsequently halts both aerobic cellular respiration and fermentation

  • NaF (Sodium Fluoride): Inhibitor of Glycolysis and Fermentation

  • Glycolysis is blocked: because enolase is inhibited, glycolysis cannot proceed to produce PEP or the final product, pyruvate

  • Fermentation stopper: fermentation (whether lactic acid or alcoholic) requires pyruvate as a starting substrate to regenerate NAD+ from NADH. Without pyruvate from glycolysis, fermentation stops entirely

  • ATP deprivation: the cell can no longer produce the net 2 ATP typically generated during glycolysis


<p>Sodium fluoride (NaF) acts as a competitive or non-competitive inhibitor of glycolysis (specifically targeting the enzyme enolase), which prevents the production of pyruvate and subsequently halts both aerobic cellular respiration and fermentation</p><ul><li><p>NaF (Sodium Fluoride): Inhibitor of Glycolysis and Fermentation</p></li></ul><ul><li><p><strong>Glycolysis is blocked:</strong> because enolase is inhibited, glycolysis cannot proceed to produce PEP or the final product, <strong>pyruvate</strong></p></li><li><p><strong>Fermentation stopper:</strong> fermentation (whether lactic acid or alcoholic) requires pyruvate as a starting substrate to regenerate NAD+ from NADH. Without pyruvate from glycolysis, <strong>fermentation stops entirely</strong></p></li><li><p><strong>ATP deprivation:</strong> the cell can no longer produce the net 2 ATP typically generated during glycolysis</p></li></ul><p></p>
49
New cards

Fermentation inhibitor

Sodium fluoride (NaF) acts as a competitive or non-competitive inhibitor of glycolysis (specifically targeting the enzyme enolase), which prevents the production of pyruvate and subsequently halts both aerobic cellular respiration and fermentation

  • NaF (Sodium Fluoride): Inhibitor of Glycolysis and Fermentation

  • Glycolysis is blocked: because enolase is inhibited, glycolysis cannot proceed to produce PEP or the final product, pyruvate

  • Fermentation stopper: fermentation (whether lactic acid or alcoholic) requires pyruvate as a starting substrate to regenerate NAD+ from NADH. Without pyruvate from glycolysis, fermentation stops entirely

  • ATP deprivation: the cell can no longer produce the net 2 ATP typically generated during glycolysis


<p>Sodium fluoride (NaF) acts as a competitive or non-competitive inhibitor of glycolysis (specifically targeting the enzyme enolase), which prevents the production of pyruvate and subsequently halts both aerobic cellular respiration and fermentation</p><ul><li><p>NaF (Sodium Fluoride): Inhibitor of Glycolysis and Fermentation</p></li></ul><ul><li><p><strong>Glycolysis is blocked:</strong> because enolase is inhibited, glycolysis cannot proceed to produce PEP or the final product, <strong>pyruvate</strong></p></li><li><p><strong>Fermentation stopper:</strong> fermentation (whether lactic acid or alcoholic) requires pyruvate as a starting substrate to regenerate NAD+ from NADH. Without pyruvate from glycolysis, <strong>fermentation stops entirely</strong></p></li><li><p><strong>ATP deprivation:</strong> the cell can no longer produce the net 2 ATP typically generated during glycolysis</p></li></ul><p></p>
50
New cards

Inhibition of fermentation

Sodium fluoride (NaF) acts as a competitive or non-competitive inhibitor of glycolysis (specifically targeting the enzyme enolase), which prevents the production of pyruvate and subsequently halts both aerobic cellular respiration and fermentation

  • NaF (Sodium Fluoride): Inhibitor of Glycolysis and Fermentation

  • Glycolysis is blocked

  • Fermentation stops

  • ATP deprivation


<p>Sodium fluoride (NaF) acts as a competitive or non-competitive inhibitor of glycolysis (specifically targeting the enzyme enolase), which prevents the production of pyruvate and subsequently halts both aerobic cellular respiration and fermentation</p><ul><li><p>NaF (Sodium Fluoride): Inhibitor of Glycolysis and Fermentation</p></li><li><p>Glycolysis is blocked</p></li><li><p>Fermentation stops</p></li><li><p>ATP deprivation</p></li></ul><p></p>
51
New cards

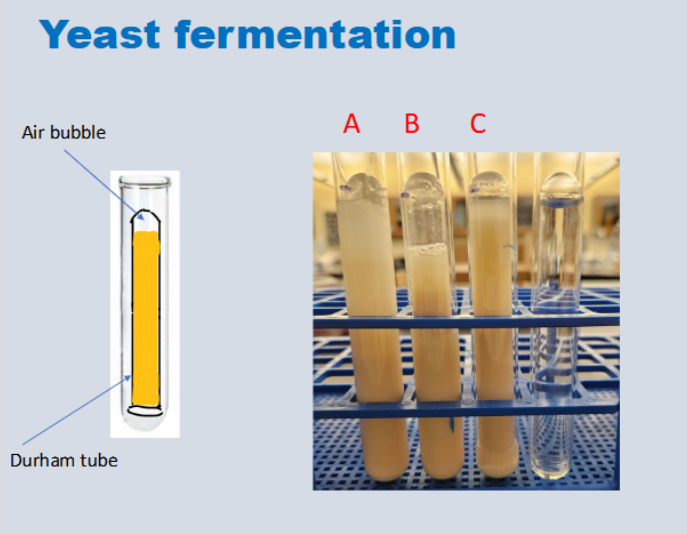
Yeast fermentation tubes

Tube B

  • 25 glucose drops

  • 0 NaF (inhibitor) drops

  • Why: because it has the biggest CO2 bubble, meaning that fermentation was able to take place and release CO2 as a byproduct


Tubes A/C

  • 25 glucose drops

  • 25 NaF (inhibitor) drops

  • Why: they have smaller air (CO2) bubbles compared to tube B, likely due to the presence of NaF which blocks the fermentation pathway, allowing little to no CO2 to be released

Final tube

  • Control

  • No glucose or NaF (inhibitor)


<p><strong>Tube B</strong></p><ul><li><p>25 glucose drops</p></li><li><p>0 NaF (inhibitor) drops </p></li><li><p>Why: because it has the biggest CO2 bubble, meaning that fermentation was able to take place and release CO2 as a byproduct</p></li></ul><p></p><p><strong>Tubes A/C</strong></p><ul><li><p>25 glucose drops</p></li><li><p>25 NaF (inhibitor) drops</p></li><li><p>Why: they have smaller air (CO2) bubbles compared to tube B, likely due to the presence of NaF which blocks the fermentation pathway, allowing little to no CO2 to be released</p></li></ul><p><strong>Final tube</strong></p><ul><li><p>Control</p></li><li><p>No glucose or NaF (inhibitor)</p></li></ul><p></p>
52
New cards

Durham tube

A Durham tube is a small, inverted (upside-down) glass vial placed inside a larger test tube containing a liquid growth or fermentation medium

  • The tube is used to trap gas (such as CO₂) produced when microorganisms ferment a specific carbohydrate (like glucose, lactose, or sucrose)

  • How it works: Before incubation, the Durham tube is completely filled with the liquid broth (with no air inside)

  • If the organism ferments the sugar and releases gas, the gas bubbles rise and accumulate at the top of the inverted tube, displacing the liquid to form a visible air pocket
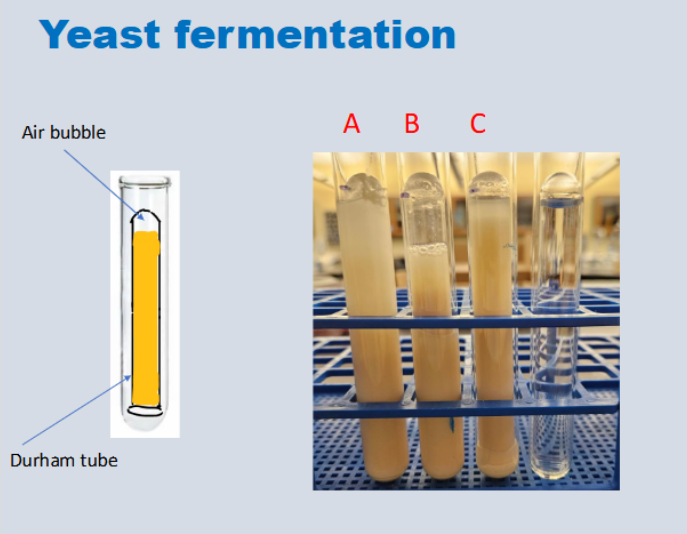

<p>A Durham tube is a small, inverted (upside-down) glass vial placed inside a larger test tube containing a liquid growth or fermentation medium</p><ul><li><p>The tube is used to <strong>trap gas (such as CO₂)</strong> produced when microorganisms ferment a specific carbohydrate (like glucose, lactose, or sucrose)</p></li><li><p><strong>How it works:</strong> Before incubation, the Durham tube is completely filled with the liquid broth (with no air inside)</p></li><li><p>If the organism ferments the sugar and releases gas, the gas bubbles rise and accumulate at the top of the inverted tube, displacing the liquid to form a visible air pocket</p></li></ul><p></p>
53
New cards

Positive durham tube test - yeast fermentation

A positive Durham tube test for yeast fermentation means that the yeast is actively breaking down a carbohydrate (such as glucose or sucrose) through alcoholic fermentation

  • Gas Production (Carbon Dioxide): An air or gas bubble is trapped at the top of the inverted small Durham tube inside the larger test tube. As the yeast respires anaerobically, it releases CO2, displacing the liquid in the inverted tube

  • The size or height of the gas pocket increases over time, showing the rate of metabolic activity

<p><span>A positive Durham tube test for yeast fermentation means that </span>the yeast is actively breaking down a carbohydrate (such as glucose or sucrose) through alcoholic fermentation</p><ul><li><p><strong>Gas Production (Carbon Dioxide):</strong> An air or gas bubble is trapped at the top of the inverted small Durham tube inside the larger test tube. As the yeast respires anaerobically, it releases CO2, displacing the liquid in the inverted tube</p></li><li><p>The size or height of the gas pocket increases over time, showing the rate of metabolic activity</p></li></ul><p></p>
54
New cards

Negative durham tube test - yeast fermentation

No carbon dioxide (CO2) gas is trapped in the inverted inner tube (no gas bubble at the top), and the solution generally shows no active fermentation or acid/gas production

  • The inverted Durham tube contains no empty space or gas pocket; it remains completely full of liquid

  • No Fermentation / Inactive Yeast: the yeast failed to break down the provided carbohydrate (sugar) into ethanol and CO2, or the experimental conditions stopped cellular respiration/fermentation

  • Presence of inhibitors (like NaF) can prevent the reaction from working


<p>No carbon dioxide (CO2) gas is trapped in the inverted inner tube (no gas bubble at the top), and the solution generally shows no active fermentation or acid/gas production</p><ul><li><p><span>The inverted Durham tube contains no empty space or gas pocket; it remains completely full of liquid</span></p></li><li><p><span><strong>No Fermentation / Inactive Yeast:</strong> the yeast failed to break down the provided carbohydrate (sugar) into ethanol and CO2, or the experimental conditions stopped cellular respiration/fermentation</span></p></li><li><p>Presence of inhibitors (like NaF) can prevent the reaction from working</p></li></ul><p></p>
55
New cards

Vernier CO2 gas sensor

A digital scientific instrument used in biology labs to measure the concentration of gaseous carbon dioxide (CO₂) in parts per million (ppm) or parts per thousand (ppt)

  • Cellular Respiration: Measuring the rate of CO₂ production in organisms like germinating peas, crickets, or yeast

  • Photosynthesis: Monitoring the decrease in CO₂ levels as plants consume the gas under a light source

<p>A digital scientific instrument used in biology labs to measure the concentration of gaseous carbon dioxide (CO₂) in parts per million (ppm) or parts per thousand (ppt)</p><ul><li><p><span><strong>Cellular Respiration:</strong> Measuring the rate of CO₂ production in organisms like germinating peas, crickets, or yeast</span></p></li><li><p><span><strong>Photosynthesis:</strong> Monitoring the decrease in CO₂ levels as plants consume the gas under a light source</span></p></li></ul><p></p>
56
New cards

Purpose of vernier CO2 gas sensor

The purpose of using a Vernier sensor in a biology cellular respiration lab is to quantify the rate of carbon dioxide (CO₂) produced by living organisms (such as germinating seeds, yeast, or small invertebrates) to measure their metabolic and respiration activity

  • The primary purpose of a Vernier CO2 sensor in a biology lab is to quantify changes in gaseous carbon dioxide (CO2) concentration over time in real-time, allowing students to measure the rates of cellular respiration or photosynthesis


<p><span>The purpose of using a Vernier sensor in a biology cellular respiration lab is to quantify the rate of carbon dioxide (CO₂) produced by living organisms (such as germinating seeds, yeast, or small invertebrates) to measure their metabolic and respiration activity</span></p><ul><li><p><span>The primary purpose of a Vernier </span>CO2 sensor in a biology lab is to quantify changes in gaseous carbon dioxide (CO2) concentration over time in real-time, allowing students to measure the rates of cellular respiration or photosynthesis</p></li></ul><p></p>
57
New cards

Vernier CO2 sensor - results for respiration

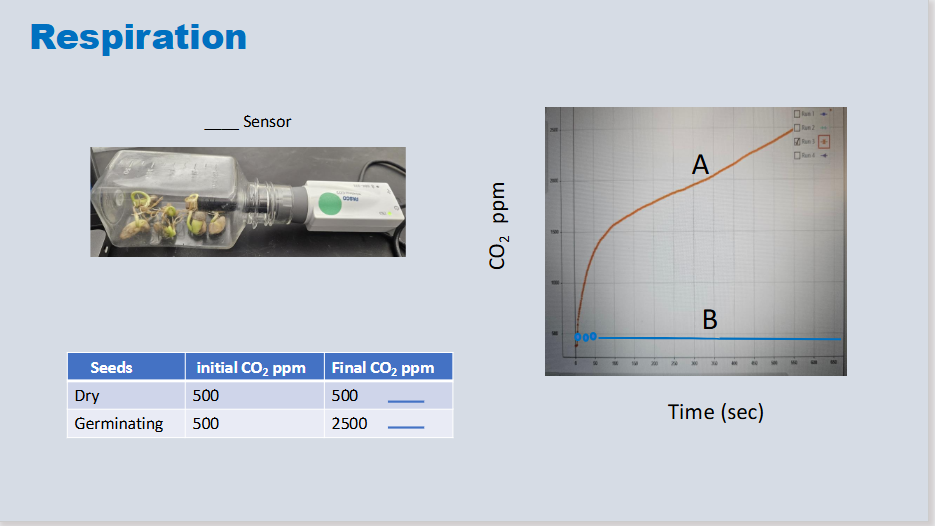
Cellular Respiration (e.g., Germinating Peas vs. Non-Germinating Peas / Crickets)

  • Purpose: Measures the rate of CO2 production (and overall respiration rate) as living organisms consume oxygen and break down glucose

  • Expected Result: An upward-sloping graph showing increasing CO2 concentration in a sealed respiration chamber

  • Quantifies real-time gaseous carbon dioxide CO2 concentration produced during cellular respiration in living organisms (such as germinating seeds, yeast, or small insects)


<p><span><strong>Cellular Respiration (e.g., Germinating Peas vs. Non-Germinating Peas / Crickets)</strong></span></p><ul><li><p><span><strong>Purpose:</strong> Measures the <strong>rate of CO2 production</strong> (and overall respiration rate) as living organisms consume oxygen and break down glucose</span></p></li><li><p><span><strong>Expected Result:</strong> An upward-sloping graph showing increasing CO2 concentration in a sealed respiration chamber</span></p></li><li><p>Quantifies real-time gaseous carbon dioxide CO2 concentration produced during cellular respiration in living organisms (such as germinating seeds, yeast, or small insects)</p></li></ul><p></p>
58
New cards

Vernier CO2 sensor - results for photosynthesis

Carbon dioxide levels are monitored inside a sealed chamber containing fresh plant leaves (such as spinach) under two distinct environmental conditions

Dark Phase (Cellular Respiration):

  • Setup: The chamber is wrapped in aluminum foil or kept in total darkness.

  • Expected Trend: CO2 concentration increases steadily over time

  • Why: In the dark, photosynthesis stops because there is no light energy. The plant continues cellular respiration, consuming oxygen and releasing carbon dioxide

Light Phase (Photosynthesis):

  • Setup: The foil is removed and the chamber is exposed to a light source

  • Expected Trend: CO2 concentration decreases (or the rate of increase flattens/drops significantly depending on net photosynthesis versus respiration).

  • Why: Light energy drives photosynthesis, causing the leaves to absorb carbon dioxide from the chamber faster than they produce it via respiration


59
New cards

Equation for rate of CO2 concentration change

Final CO2 ppm - Initial CO2 ppm ÷ time elapsed (seconds) = rate of CO2 concentration change (ppm/sec)

  • Change in CO2 concentration ppm ➗time elapsed (seconds) = rate of CO2 concentration change (ppm/sec)


<p>Final CO2 ppm - Initial CO2 ppm ÷ time elapsed (seconds) = rate of CO2 concentration change (ppm/sec)</p><ul><li><p>Change in CO2 concentration ppm <span data-name="divide" data-type="emoji">➗</span>time elapsed (seconds) = rate of CO2 concentration change (ppm/sec)</p></li></ul><p></p>
60
New cards

Equation for rate of CO2 concentration change

Final CO2 ppm - Initial CO2 ppm ÷ time elapsed (seconds) = rate of CO2 concentration change (ppm/sec)

  • Change in CO2 concentration ppm ➗time elapsed (seconds) = rate of CO2 concentration change (ppm/sec)


<p>Final CO2 ppm - Initial CO2 ppm ÷ time elapsed (seconds) = rate of CO2 concentration change (ppm/sec)</p><ul><li><p>Change in CO2 concentration ppm <span data-name="divide" data-type="emoji">➗</span>time elapsed (seconds) = rate of CO2 concentration change (ppm/sec)</p></li></ul><p></p>
61
New cards

Vernier CO2 sensor results for respiration

When using a Vernier CO2 Gas Sensor to measure cellular respiration in a lab (commonly using germinating peas, non-germinating peas, or yeast), typical results show distinct patterns:

  • Germinating Peas (Room Temperature):

    • CO2 concentration steadily increases over time (measured in parts per million [ppm] or parts per thousand [ppt])

    • The graph displays a positive linear slope, indicating active metabolic respiration and glucose breakdown

  • Non-Germinating Peas (Control):

    • CO2 concentration remains flat or shows a very minimal increase, because metabolic activity is dormant in dry, non-germinating seeds


<p>When using a Vernier CO2 Gas Sensor to measure cellular respiration in a lab (commonly using germinating peas, non-germinating peas, or yeast), typical results show distinct patterns:</p><ul><li><p><span><strong>Germinating Peas (Room Temperature):</strong></span></p><ul><li><p><span>CO2 concentration steadily <strong>increases</strong> over time (measured in parts per million [ppm] or parts per thousand [ppt])</span></p></li><li><p><span>The graph displays a positive linear slope, indicating active metabolic respiration and glucose breakdown</span></p></li></ul></li><li><p><span><strong>Non-Germinating Peas (Control):</strong></span></p><ul><li><p><span>CO2 concentration remains <strong>flat or shows a very minimal increase</strong>, because metabolic activity is dormant in dry, non-germinating seeds</span></p></li></ul></li></ul><p></p>
62
New cards

Germinating vs. Non- germinating seeds (dry) - respiration

Germinating seeds have a significantly higher rate of cellular respiration than non-germinating (dormant) seeds

  • Active Growth: germinating seeds are actively undergoing mitosis, cell division, and tissue growth to break the seed coat and sprout. This requires a massive amount of energy (ATP)

  • Low Activity in Dormant Seeds: non-germinating seeds are dormant; their metabolic machinery is slowed down to a bare minimum just to keep the embryo alive until conditions are right


63
New cards

Germinating vs. Non- germinating seeds (dry) - respiration

Germinating seeds show a high rate of cellular respiration, while dry (non-germinating) seeds show little to no measurable respiration

  • Germinating Seeds: actively growing seeds break down stored glucose and organic molecules to produce energy (ATP), which releases CO2 gas and consumes O2

  • Dry (Non-Germinating) Seeds: dormant seeds have very low metabolic activity. They produce a negligible or flatline amount of CO2 over the same time period

  • Measured using vernier CO2 gas sensor


<p>Germinating seeds show a high rate of cellular respiration, while dry (non-germinating) seeds show little to no measurable respiration</p><ul><li><p><span><strong>Germinating Seeds:</strong> actively growing seeds break down stored glucose and organic molecules to produce energy (ATP), which releases CO2 gas and consumes O2</span></p></li><li><p><span><strong>Dry (Non-Germinating) Seeds:</strong> dormant seeds have very low metabolic activity. They produce a negligible or flatline amount of CO2 over the same time period</span></p></li><li><p>Measured using vernier CO2 gas sensor</p></li></ul><p></p>
64
New cards

Can germinating seeds undergo photosynthesis?

No, germinating seeds do not undergo photosynthesis

  • Lack of Structures: Seeds do not have functional chloroplasts or mature green leaves to capture light and carry out the reactions of photosynthesis

  • germinating seeds undergo cellular respiration at a very high rate

  • It needs a large amount of energy (ATP) to push out roots and shoots before it can start making its own food through photosynthesis


<p><span>No, </span>germinating seeds do not undergo photosynthesis</p><ul><li><p><strong>Lack of Structures:</strong> Seeds do not have functional chloroplasts or mature green leaves to capture light and carry out the reactions of photosynthesis</p></li><li><p><span>germinating seeds undergo </span><strong>cellular respiration</strong> at a very high rate</p></li><li><p>It needs a large amount of energy (ATP) to push out roots and shoots before it can start making its own food through photosynthesis</p></li></ul><p></p>
65
New cards

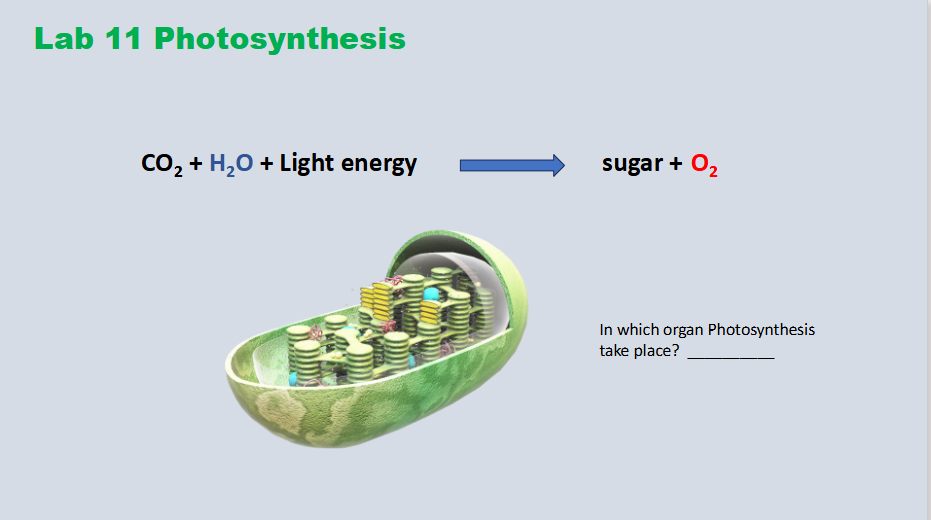
Photosynthesis overall equation

CO2 + H2O + Light energy → sugar + O2

In what organelle does photosynthesis take place?

  • The chloroplast (high concentration of chloroplasts located in mesophyll cells of leaves)

<p>CO2 + H2O + Light energy → sugar + O2</p><p>In what organelle does photosynthesis take place?</p><ul><li><p>The chloroplast (high concentration of chloroplasts located in mesophyll cells of leaves)</p></li></ul><p></p>
66
New cards

Rate of CO2 production - dark vs. light

Light Conditions (Photosynthesis Dominates):

  • CO2 Production / Net Change: Net consumption of CO2 (rate of CO2 production drops or becomes negative relative to output, as plants actively take in CO2 for the Calvin cycle faster than respiration produces it)

Dark Conditions (Respiration Dominates):

  • CO2 Production / Net Change: Net production of CO2 (photosynthesis stops completely in the absence of light, while cellular respiration continues, releasing CO2 as a metabolic waste product)
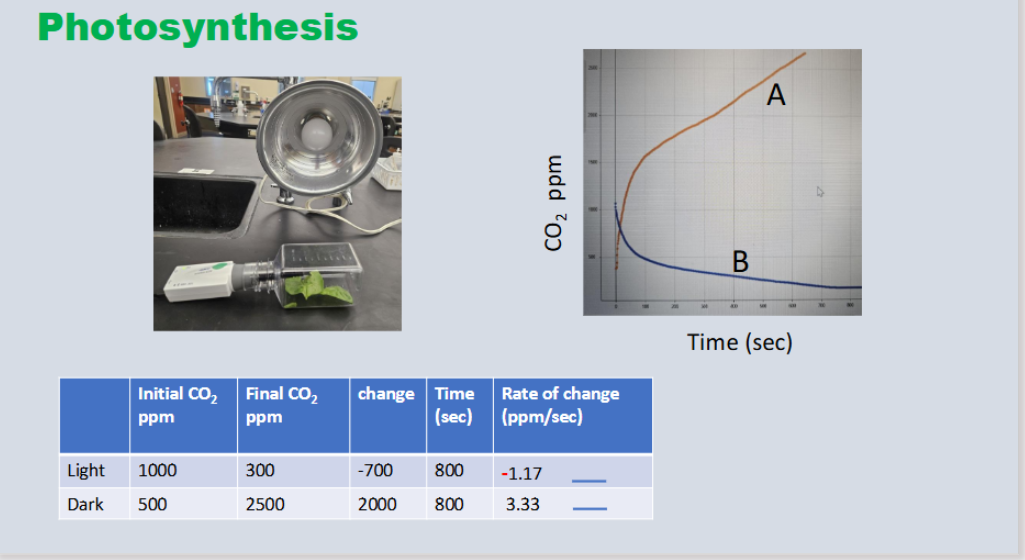

<p><span><strong>Light Conditions (Photosynthesis Dominates):</strong></span></p><ul><li><p><span><strong>CO2 Production / Net Change:</strong> <strong>Net consumption</strong> of CO2 (rate of CO2 production drops or becomes negative relative to output, as plants actively take in CO2 for the Calvin cycle faster than respiration produces it)</span></p></li></ul><p><span><strong>Dark Conditions (Respiration Dominates):</strong></span></p><ul><li><p><span><strong>CO2 Production / Net Change:</strong> <strong>Net production</strong> of CO2 (photosynthesis stops completely in the absence of light, while cellular respiration continues, releasing CO2 as a metabolic waste product)</span></p></li></ul><p></p>
67
New cards

Rate of CO2 production in leaves - dark

In the dark conditions of the Vernier CO₂ sensor lab, leaves show a positive rate of CO₂ production (a positive slope on the graph) because cellular respiration is active while photosynthesis is stopped

  • The chamber is wrapped in aluminum foil to block all light

  • Without light, the leaves cannot perform the light-dependent or light-independent reactions of photosynthesis. Instead, they perform aerobic cellular respiration, which releases CO₂ gas as a metabolic byproduct

  • The CO₂ concentration in the sealed biochamber increases over time, resulting in a positive slope

  • Photosynthesis stops due to the lack of light, leaving only cellular respiration producing CO₂.


<p><span>In the dark conditions of the Vernier CO₂ sensor lab, leaves show a </span><strong>positive rate of CO₂ production</strong> (a positive slope on the graph) because <strong>cellular respiration</strong> is active while photosynthesis is stopped</p><ul><li><p>The chamber is wrapped in aluminum foil to block all light</p></li><li><p>Without light, the leaves cannot perform the light-dependent or light-independent reactions of photosynthesis. Instead, they perform <strong>aerobic cellular respiration</strong>, which releases CO₂ gas as a metabolic byproduct</p></li><li><p>The CO₂ concentration in the sealed biochamber increases over time, resulting in a <strong>positive slope</strong></p></li><li><p>Photosynthesis stops due to the lack of light, leaving only cellular respiration producing CO₂.</p></li></ul><p></p>
68
New cards

Rate of CO2 production in leaves - light

In light conditions, the net rate of CO₂ in a leaf chamber typically decreases (or shows a negative slope on a CO₂ sensor graph) because photosynthesis consumes carbon dioxide faster than cellular respiration produces it

In the Light (Photosynthesis + Respiration):

  • CO₂ Level: decreases over time.

  • Interpretation: the rate of CO₂ uptake by photosynthesis is greater than the rate of CO₂ released by cellular respiration.

  • Graph Slope: negative (e.g., in ppm/min or ppt/min)

  • the rate of CO2 production typically shows a net decrease (or a negative slope/negative rate) because the rate of CO2 consumed by photosynthesis outpaces the rate of CO2 produced by cellular respiration


<p><span>In light conditions, the </span>net rate of CO₂ in a leaf chamber typically decreases (or shows a negative slope on a CO₂ sensor graph) because photosynthesis consumes carbon dioxide faster than cellular respiration produces it</p><p><span><strong>In the Light (Photosynthesis + Respiration):</strong></span></p><ul><li><p><span><strong>CO₂ Level:</strong> decreases over time.</span></p></li><li><p><span><strong>Interpretation:</strong> the rate of CO₂ uptake by photosynthesis is greater than the rate of CO₂ released by cellular respiration.</span></p></li><li><p><span><strong>Graph Slope:</strong> negative (e.g., in ppm/min or ppt/min)</span></p></li><li><p>the rate of CO2 production typically shows a net decrease (or a negative slope/negative rate) because the rate of CO2 consumed by photosynthesis outpaces the rate of CO2 produced by cellular respiration</p></li></ul><p></p>
69
New cards

Spectrometer

An instrument used to measure how much light a chemical substance absorbs or transmits at a specific wavelength

  • Sample (Cuvette): The light passes through a small plastic or glass tube containing the liquid sample

  • Detector: A sensor on the other side measures the light that successfully passed through the sample


<p>An instrument used to <strong>measure how much light a chemical substance absorbs or transmits at a specific wavelength</strong></p><ul><li><p><span><strong>Sample (Cuvette):</strong> The light passes through a small plastic or glass tube containing the liquid sample</span></p></li><li><p><span><strong>Detector:</strong> A sensor on the other side measures the light that successfully passed through the sample</span></p></li></ul><p></p>
70
New cards

Spectrophotometry

An analytical method used to measure how much light a chemical substance absorbs by determining the intensity of light that passes through a solution

  • a spectrophotometer shines a specific wavelength of light through a liquid sample (held in a tube called a cuvette). A detector measures the amount of light that transmits through the sample versus how much is blocked or absorbed

  • Absorbance (A): the amount of light trapped by the molecules in the sample. Higher concentration = Higher absorbance.


<p><span>An analytical method used to measure how much light a chemical substance absorbs by determining the intensity of light that passes through a solution</span></p><ul><li><p>a spectrophotometer shines a specific wavelength of light through a liquid sample (held in a tube called a cuvette). A detector measures the amount of light that transmits through the sample versus how much is blocked or absorbed</p></li><li><p><strong>Absorbance (A):</strong> the amount of light trapped by the molecules in the sample. <strong>Higher concentration = Higher absorbance.</strong></p></li></ul><p></p>
71
New cards

Visible light range

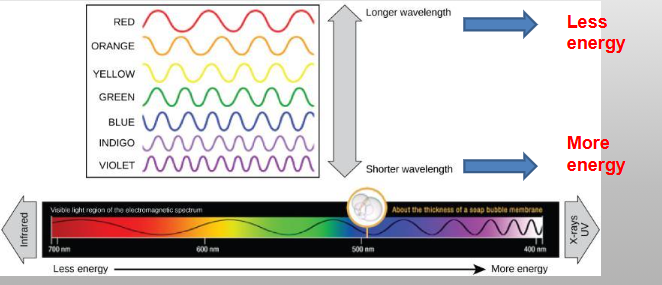
The portion of the electromagnetic spectrum that can be detected by the human eye

  • Plants use visible light as energy for photosynthesis

  • In the visible range (700-400nm), violet have the shortest
    wavelengths (most energy), and the reds have the longest wavelength (least energy)

  • Wavelengths are measured in Nanometers (nm)


<p>The portion of the electromagnetic spectrum that can be detected by the human eye </p><ul><li><p><span>Plants use visible light as energy for photosynthesis</span></p></li><li><p><span>In the visible range (700-400nm), violet have the shortest</span><br><span>wavelengths (most energy), and the reds have the longest wavelength (least energy)</span></p></li><li><p><span>Wavelengths are measured in Nanometers (nm)</span></p></li></ul><p></p>
72
New cards

Photoautotrophs

An organism that captures light energy and uses carbon dioxide (CO2) to synthesize its own organic compounds

  • use sunlight to make food

  • plants

  • algae

  • cyanobacteria


73
New cards

Visible light spectrum

  • Violet/blue - shortest wavelength / highest energy

  • Red - longest wavelength / least energy

  • 400nm - 700nm


<ul><li><p>Violet/blue - shortest wavelength / highest energy</p></li><li><p>Red - longest wavelength / least energy</p></li><li><p>400nm - 700nm</p></li></ul><p></p>
74
New cards

Photosynthesis

Converts solar energy into glucose (potential energy)

  • Carbon dioxide + water + light → glucose + oxygen


75
New cards

Absorbance spectrum

A graph that shows how much light a specific pigment or substance absorbs across different wavelengths of electromagnetic radiation (typically in the visible and UV light ranges)

  • Pigments absorb specific wavelengths of light; each has a unique absorbance spectrum

  • X-axis: Wavelength of light (measured in nanometers, nm).

  • Y-axis: Amount of light absorbed (absorbance or percentage of light absorbed)


<p>A graph that shows how much light a specific pigment or substance absorbs across different wavelengths of electromagnetic radiation (typically in the visible and UV light ranges)</p><ul><li><p><span>Pigments absorb specific wavelengths of light; each has a unique absorbance spectrum</span></p></li><li><p><span><strong>X-axis:</strong> Wavelength of light (measured in nanometers, nm).</span></p></li><li><p><span><strong>Y-axis:</strong> Amount of light absorbed (absorbance or percentage of light absorbed)</span></p></li></ul><p></p>
76
New cards

Main pigments of the thylakoid membranes

  • Chlorophyll a and b capture light for photosynthesis (green
    wavelengths are reflected)

  • β-carotene helps to protect photosystems by dissipating
    excess energy (found in cells of carrots & oranges)

  • Other carotenoids: lycopene (red color of tomato) and
    zeaxanthin (yellow of corn seeds)


77
New cards

Chlorophyll

The green pigment that captures the light energy that drives the reactions of photosynthesis; it absorbs all visible light except green

  • the primary green light-absorbing pigment in plants, algae, and cyanobacteria that captures solar energy to drive the light-dependent reactions of photosynthesis

  • Peaks (High Absorption): Chlorophyll a and chlorophyll b do not absorb all light equally; they absorb most strongly in the blue-violet (approx. 430–450 nm) and red (approx. 640–680 nm) regions of the visible spectrum

  • Troughs (Low Absorption / Reflection): Green and yellow-green wavelengths (approx. 500–600 nm) are poorly absorbed. Instead, they are reflected or transmitted, which is why plant leaves appear green to the human eye


<p><span>The green pigment that captures the light energy that drives the reactions of photosynthesis; it absorbs all visible light except green</span></p><ul><li><p>the primary green light-absorbing pigment in plants, algae, and cyanobacteria that captures solar energy to drive the light-dependent reactions of photosynthesis</p></li></ul><ul><li><p><span><strong>Peaks (High Absorption):</strong> Chlorophyll <em>a</em> and chlorophyll <em>b</em> do not absorb all light equally; they absorb most strongly in the <strong>blue-violet</strong> (approx. 430–450 nm) and <strong>red</strong> (approx. 640–680 nm) regions of the visible spectrum</span></p></li><li><p><span><strong>Troughs (Low Absorption / Reflection):</strong> Green and yellow-green wavelengths (approx. 500–600 nm) are poorly absorbed. Instead, they are reflected or transmitted, which is why plant leaves appear green to the human eye</span></p></li></ul><p></p>
78
New cards

What color is represented by this graph?

The graph represents the absorbance spectrum of chlorophyll, which absorbs violet/blue and red light but reflects green light

  • The graph shows very high absorbance in the blue/violet region and the red region. It has the lowest absorbance in the green/yellow region

  • Because green light is reflected and transmitted rather than absorbed, the substance looks green to our eyes


<p>The graph represents the absorbance spectrum of chlorophyll, which absorbs violet/blue and red light but reflects green light</p><ul><li><p>The graph shows very high absorbance in the blue/violet region and the red region. It has the lowest absorbance in the green/yellow region</p></li><li><p>Because green light is reflected and transmitted rather than absorbed, the substance looks green to our eyes</p></li></ul><p></p>
79
New cards

What is the range of wavelengths for the visible light spectrum?

400nm-700nm

  • 400 nm to 700 nm

  • Violet/blue - shortest wavelength / most energy

  • Red - longest wavelength / least energy


<p>400nm-700nm</p><ul><li><p>400 nm to 700 nm</p></li><li><p>Violet/blue - shortest wavelength / most energy</p></li><li><p>Red - longest wavelength / least energy</p></li></ul><p></p>
80
New cards

Absorbance spectrum of chlorophyll

  • Peaks (High Absorption): Chlorophyll a and chlorophyll b do not absorb all light equally; they absorb most strongly in the blue-violet (approx. 430–450 nm) and red (approx. 640–680 nm) regions of the visible spectrum

  • Troughs (Low Absorption / Reflection): Green and yellow-green wavelengths (approx. 500–600 nm) are poorly absorbed. Instead, they are reflected or transmitted, which is why plant leaves appear green to the human eye


81
New cards

What light does chlorophyll absorb?

  • Violet/blue and red light

  • Or you can say it absorbs all wavelengths except green

  • absorbs blue-violet and red wavelengths of the visible light spectrum (roughly 400–450 nm and 650–700 nm), while it reflects green light


82
New cards

What wavelengths does chlorophyll not absorb?

Chlorophyll does not absorb green/yellow light

  • Because these wavelengths are poorly absorbed, they are reflected back and transmitted to our eyes


<p>Chlorophyll does not absorb green/yellow light</p><ul><li><p>Because these wavelengths are poorly absorbed, they are reflected back and transmitted to our eyes</p></li></ul><p></p>
83
New cards

Purpose of mitosis (cell division)

  • Cell division

  • Growth

  • Development

  • Repair

  • Cancer


84
New cards

Purpose of mitosis (cell division)

  • Cell division

  • Growth

  • Development

  • Repair

  • Cancer


85
New cards

Functions of cell division

Multicellular organisms use cell division for:

  • Growth

  • Maintenance

  • Repair injured cells and tissues

  • Development

  • Single-celled organisms use cell division to reproduce


86
New cards

Functions of cell division:

Multicellular organisms use cell division for:

  • Growth

  • Maintenance

  • Repair injured cells and tissues

  • Development

  • Single-celled organisms use cell division to reproduce


87
New cards

Mitosis

A process of nuclear division in eukaryotic cells where a single diploid (2n) parent cell replicates its chromosomes and segregates them into two genetically identical diploid (2n) daughter cells

  • Chromosome Number: Starts with a diploid (2n) cell, replicates DNA (temporary 4n), and divides once to yield two diploid (2n) daughter cells

  • 1 division; 2 identical cells


<p>A process of nuclear division in eukaryotic cells where a single diploid (2n) parent cell replicates its chromosomes and segregates them into <strong>two genetically identical diploid (2n) daughter cells</strong></p><ul><li><p><strong>Chromosome Number:</strong> Starts with a diploid (2n) cell, replicates DNA (temporary 4n), and divides once to yield two diploid (2n) daughter cells</p></li><li><p>1 division; 2 identical cells</p></li></ul><p></p>
88
New cards

S phase

The period during interphase in the eukaryotic cell cycle when the cell replicates its entire genome and duplicates its centrosomes

  • the period during interphase in the eukaryotic cell cycle when the cell makes a complete copy of its nuclear DNA and duplicates its centrosomes


<p>The period during <strong>interphase</strong> in the eukaryotic cell cycle when the cell replicates its entire genome and duplicates its centrosomes</p><ul><li><p>the period during <strong>interphase</strong> in the eukaryotic cell cycle when the cell makes a complete copy of its nuclear DNA and duplicates its centrosomes</p></li></ul><p></p>
89
New cards

Prophase

The first and longest phase of mitosis (and the M phase), where the cell prepares its nuclear material for equal division into two genetically identical daughter cells

  • Chromosomes condense (the tight coiling and compacting of loose chromatin fibers into short, distinct, rod-shaped chromosomes during the start of cell division)

  • The nucleus membrane breaks down

  • The organelles move toward edges of the cell

  • Centrosomes move to the poles of the cell

  • The spindle microtubules form

  • Duplicated chromosomes condense


<p>The first and longest phase of <strong>mitosis</strong> (and the M phase), where the cell prepares its nuclear material for equal division into two genetically identical daughter cells</p><ul><li><p><span>Chromosomes condense (</span>the tight coiling and compacting of loose chromatin fibers into short, distinct, rod-shaped chromosomes during the start of cell division)</p></li></ul><ul><li><p><span>The nucleus membrane breaks down</span></p></li><li><p><span>The organelles move toward edges of the cell</span></p></li><li><p><span>Centrosomes move to the poles of the cell</span></p></li><li><p><span>The spindle microtubules form</span></p></li><li><p>Duplicated chromosomes condense </p></li></ul><p></p>
90
New cards

Metaphase

The stage of mitosis where the cell’s condensed, duplicated chromosomes align single-file along the metaphase plate (the equator or middle plane of the cell)

  • Chromosomes line up in the middle (metaphase plate)

  • Sister chromatids remain attached

  • Spindle Attachment: Kinetochore microtubules from the mitotic spindle attach to the protein complexes (kinetochores) at the centromere of each sister chromatid

  • Duplicated chromosomes migrate to the equitorial plane (metaphase plate) of the cell and the nuclear membrane breaks down
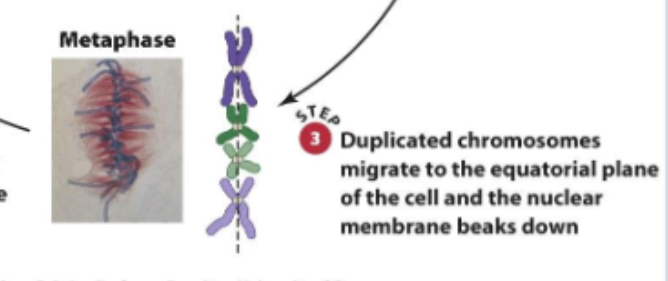

<p>The stage of mitosis where the cell’s condensed, duplicated chromosomes align single-file along the <strong>metaphase plate</strong> (the equator or middle plane of the cell)</p><ul><li><p><span>Chromosomes line up in the middle (metaphase plate)</span></p></li><li><p><span>Sister chromatids remain attached</span></p></li><li><p><strong>Spindle Attachment:</strong> Kinetochore microtubules from the mitotic spindle attach to the protein complexes (kinetochores) at the centromere of each sister chromatid</p></li><li><p>Duplicated chromosomes migrate to the equitorial plane (metaphase plate) of the cell and the nuclear membrane breaks down</p></li></ul><p></p>
91
New cards

Anaphase

The stage of mitosis where sister chromatids separate at the centromere and are pulled by spindle fibers toward opposite poles (ends) of the cell

  • Cohesin proteins break down allowing the chromatids to separate

  • Sister chromatids move in opposite directions toward the centrosomes to which their microtubules are attached

  • The cell elongates

  • Sister chromatids of each duplicated chromosome move to opposite poles of the cell


<p>The stage of mitosis where sister chromatids separate at the centromere and are pulled by spindle fibers toward opposite poles (ends) of the cell</p><ul><li><p><span>Cohesin proteins break down allowing the chromatids to separate</span></p></li><li><p><span>Sister chromatids move in opposite directions toward the centrosomes to which their microtubules are attached</span></p></li><li><p><span>The cell elongates</span></p></li><li><p>Sister chromatids of each duplicated chromosome move to opposite poles of the cell</p></li></ul><p></p>
92
New cards

Telophase

The final phase of mitosis where two new nuclear envelopes form around the separated sets of chromosomes at opposite poles of the cell, and the chromosomes begin to decondense back into chromatin

  • Chromosomes reach poles and become less dense

  • Spindles break into tubulin monomers

  • Nuclear membrane forms around chromosomes


<p>The final phase of mitosis where two new nuclear envelopes form around the separated sets of chromosomes at opposite poles of the cell, and the chromosomes begin to decondense back into chromatin</p><ul><li><p>Chromosomes reach poles and become less dense</p></li><li><p>Spindles break into tubulin monomers</p></li><li><p>Nuclear membrane forms around chromosomes</p></li></ul><p></p>
93
New cards

Cytokinesis

The physical process of cell division that splits the cytoplasm, organelles, and plasma membrane of a parent cell into two distinct daughter cells

  • the physical splitting of the cytoplasm and its contents that completes cell division, producing two separate daughter cells

  • Membrane forms between daughter cells

  • Animal: forms cleavage furrow

  • Plants in cytokinesis form a cell plate


<p><span>The physical process of cell division that splits the cytoplasm, organelles, and plasma membrane of a parent cell into two distinct daughter cells</span></p><ul><li><p>the physical splitting of the cytoplasm and its contents that completes cell division, producing two separate daughter cells</p></li></ul><ul><li><p>Membrane forms between daughter cells </p></li></ul><ul><li><p><span>Animal: forms cleavage furrow</span></p></li><li><p>Plants in cytokinesis form a cell plate</p></li></ul><p></p>
94
New cards

Mitosis: Prophase

Be able to identify and describe these structures:

  • Sister chromatids

  • Spindle fibers

  • Centrosomes

  • Centrioles

  • Centromere


<p>Be able to identify and describe these structures:</p><ul><li><p>Sister chromatids </p></li><li><p>Spindle fibers</p></li><li><p>Centrosomes </p></li><li><p>Centrioles</p></li><li><p>Centromere</p></li></ul><p></p>
95
New cards

Sister chromatids

Two identical copies of a single replicated chromosome. They form during the S phase (synthesis phase) of interphase when DNA replicates

  • two identical copies of a single chromosome that are joined together by a specialized region called the centromere
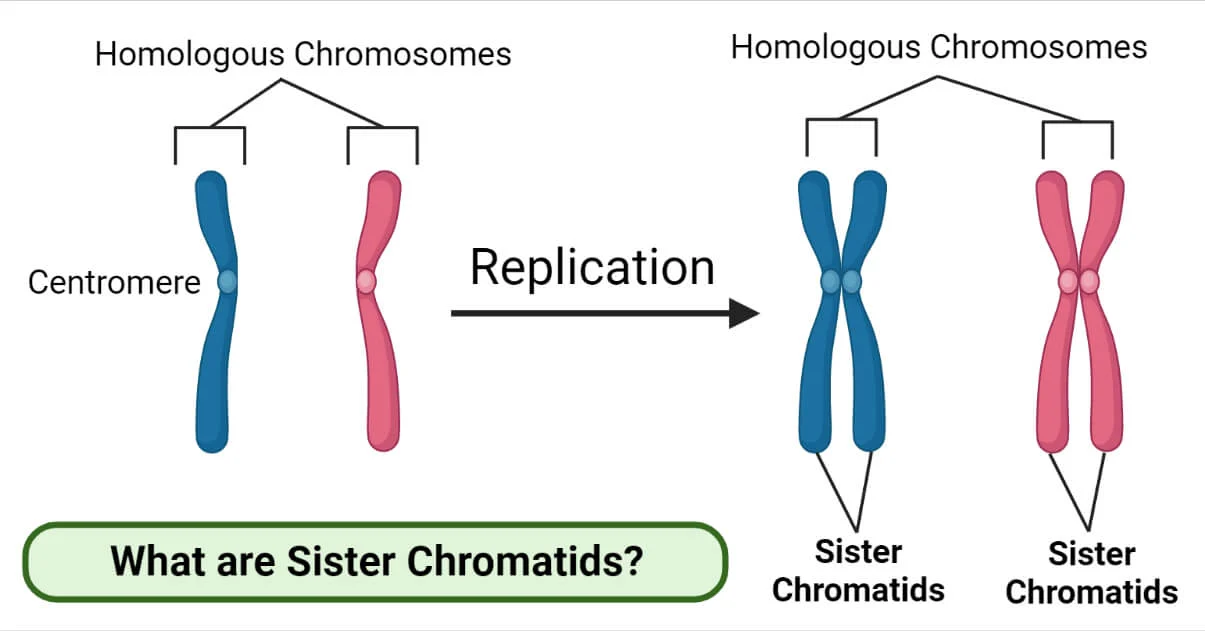

<p>Two identical copies of a single replicated chromosome. They form during the S phase (synthesis phase) of interphase when DNA replicates</p><ul><li><p>two identical copies of a single chromosome that are joined together by a specialized region called the <strong>centromere</strong></p></li></ul><p></p>
96
New cards

Spindle fibers

Bundles of microtubules (hollow protein strands made of tubulin dimers) that organize and move chromosomes during mitosis and meiosis

  • they begin to assemble during prophase (or prophase I/II in meiosis) as the centrosomes migrate to opposite ends of the cell

  • Kinetochore Attachment: some spindle fibers attach to the kinetochore, a protein structure located at the centromere of each chromosome


<p>Bundles of <strong>microtubules</strong> (hollow protein strands made of tubulin dimers) that organize and move chromosomes during <strong>mitosis</strong> and <strong>meiosis</strong></p><ul><li><p>they begin to assemble during <strong>prophase</strong> (or prophase I/II in meiosis) as the centrosomes migrate to opposite ends of the cell</p></li><li><p><strong>Kinetochore Attachment:</strong> some spindle fibers attach to the <strong>kinetochore</strong>, a protein structure located at the <strong>centromere</strong> of each chromosome</p></li></ul><p></p>
97
New cards

Centrosomes

The primary microtubule-organizing center (MTOC) in animal and many eukaryotic cells, acting as the anchor point from which spindle fibers grow

  • the main microtubule-organizing center (MTOC) in animal cells. It acts as the structural command center that builds and organizes the mitotic spindle during cell division

  • Interphase (S Phase): The single centrosome replicates alongside the DNA, producing two separate centrosomes


<p>The primary <strong>microtubule-organizing center (MTOC)</strong> in animal and many eukaryotic cells, acting as the anchor point from which spindle fibers grow</p><ul><li><p>the main <strong>microtubule-organizing center (MTOC)</strong> in animal cells. It acts as the structural command center that builds and organizes the <strong>mitotic spindle</strong> during cell division</p></li><li><p><strong>Interphase (S Phase):</strong> The single centrosome <strong>replicates</strong> alongside the DNA, producing two separate centrosomes</p></li></ul><p></p>
98
New cards

Centrioles

  • Structure: a small, barrel-shaped organelle made of nine triplets of microtubules arranged in a ring

  • Location: found in animal cells, usually in pairs (oriented at right angles to each other) inside a larger region called the centrosome near the nucleus

  • Centrioles sit inside the centrosome (the primary microtubule-organizing center or MTOC)


<ul><li><p><span><strong>Structure:</strong> a small, barrel-shaped organelle made of <strong>nine triplets of microtubules</strong> arranged in a ring</span></p></li><li><p><span><strong>Location:</strong> found in animal cells, usually in pairs (oriented at right angles to each other) inside a larger region called the <strong>centrosome</strong> near the nucleus</span></p></li><li><p><span>Centrioles sit <em>inside</em> the centrosome (the primary microtubule-organizing center or MTOC)</span></p></li></ul><p></p>
99
New cards

Centromere

The specialized, constricted region of a duplicated chromosome where two sister chromatids are held most closely together

  • the specialized, constricted region of a duplicated chromosome where two sister chromatids are held most closely together and where kinetochore protein complexes assemble to attach to spindle fibers during cell division (mitosis and meiosis)

  • the centromere holds identical copies of a replicated chromosome together (cohesin proteins are concentrated here) until they separate during anaphase


<p>The specialized, constricted region of a duplicated chromosome where two <strong>sister chromatids</strong> are held most closely together</p><ul><li><p>the specialized, constricted region of a duplicated chromosome where two <strong>sister chromatids</strong> are held most closely together and where <strong>kinetochore</strong> protein complexes assemble to attach to spindle fibers during cell division (mitosis and meiosis)</p></li><li><p>the centromere holds identical copies of a replicated chromosome together (cohesin proteins are concentrated here) until they separate during anaphase</p></li></ul><p></p>
100
New cards

Mitosis: metaphase

The stage of mitosis where the cell’s condensed, duplicated chromosomes align single-file along the metaphase plate (the equator or middle plane of the cell)

  • Chromosomes line up in the middle (metaphase plate)

  • Sister chromatids remain attached

  • Spindle Attachment: Kinetochore microtubules from the mitotic spindle attach to the protein complexes (kinetochores) at the centromere of each sister chromatid
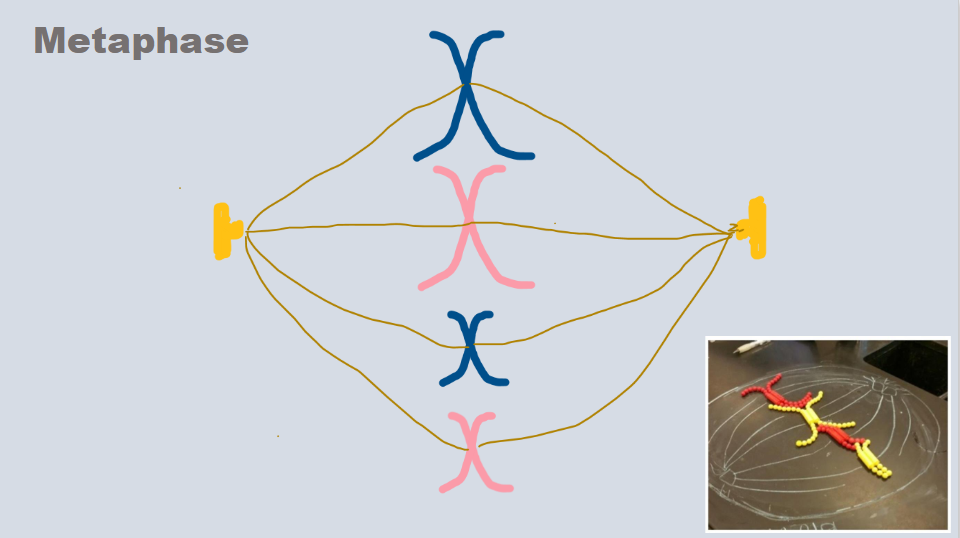


<p>The stage of mitosis where the cell’s condensed, duplicated chromosomes align single-file along the <strong>metaphase plate</strong> (the equator or middle plane of the cell)</p><ul><li><p>Chromosomes line up in the middle (metaphase plate)</p></li><li><p>Sister chromatids remain attached</p></li><li><p><strong>Spindle Attachment:</strong> Kinetochore microtubules from the mitotic spindle attach to the protein complexes (kinetochores) at the centromere of each sister chromatid</p></li></ul><p><br></p>