3-215 - Population ecology
 Call Kai
 Learn
Learn Practice Test
 Spaced Repetition
 Match
Match Flashcards
 Knowt Play
1/59

There's no tags or description
Looks like no tags are added yet.
Name | Mastery | Learn | Test | Matching | Spaced | Call with Kai | Chat |
|---|
No analytics yet
Send a link to your students to track their progress
60 Terms
define cosmopolitan, highly restricted, widespread, limited
Cosmopolitan: could be in all continents or all oceans
Highly restricted (endemic): Species that naturally exist in only one unique geographical location in the entire world (such as a single island, mountain range, or small valley) and nowhere else.
Widespread: Species with a very large, continuous geographic range that spans significant parts of a continent or landmass, though they are not globally ubiquitous
Limited: Species confined to a specific, narrow geographic strip or corridor due to highly precise climate, moisture, or soil requirements.

what are the 3 types of distributions?

what are the 2 major reasons for clumped distributions?


migratory movement of pacific salmon:
Anadromous Migration: Pacific salmon are anadromous, meaning they are born in freshwater, migrate to the ocean to grow, and return to freshwater to reproduce.
2. Life Stage Transitions (The Photos)
The three colored images show the distinct life stages corresponding to different phases of this migration:
Juveniles (Top Right): Shows young salmon (fry or smolt) schooling together. At this stage, they develop the physiological ability to transition from freshwater rivers to the salty ocean environment.
Ocean Feeding / Upstream Migration (Bottom Right): Depicts adult salmon leaping up a waterfall. This highlights the immense physical effort required during their upstream spawning migration against strong currents.
Spawning Adults (Top Center): Shows mature salmon in their vibrant red spawning colors back in their shallow freshwater home streams, where they will lay eggs and complete their life cycle.
From a population ecology perspective, this slide highlights how movement affects a population's survival, gene flow, and resource utilization. By migrating to the rich ocean, salmon can support a much larger population size than if they stayed in nutrient-poor freshwater streams their whole lives.

monarch butterfly:
Unlike the salmon, which complete their migration in a single lifetime, the Eastern North American monarch population relies on four successive generations to complete a single annual migration loop.
Generation 1 (Spring Migrants): Emerges in early spring from the overwintering adults in Mexico. They fly north, mate, lay eggs on milkweed plants primarily across the southern United States, and die shortly after.
Generation 2 & 3 (Summer Residents): These generations hatch, grow rapidly as caterpillars feeding exclusively on milkweed, metamorphose into adults, and continue traveling further north into the northern United States and Canada. They live short lives of only 2 to 6 weeks, focusing entirely on reproduction.
Generation 4 (The "Super Generation"): Born in late summer/early fall, these butterflies are biologically different. Instead of mating immediately, they enter reproductive diapause (temporary stasis) to conserve energy. This generation lives an extraordinary 6 to 8 months to complete the grueling southwards migration back to the Oyamel fir forests of Mexico, where they hibernate over the winter to restart the entire cycle next spring.
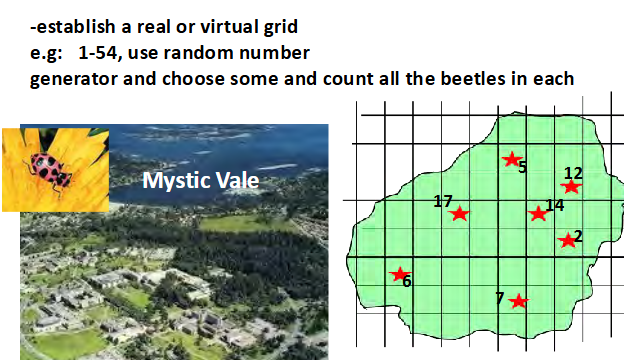
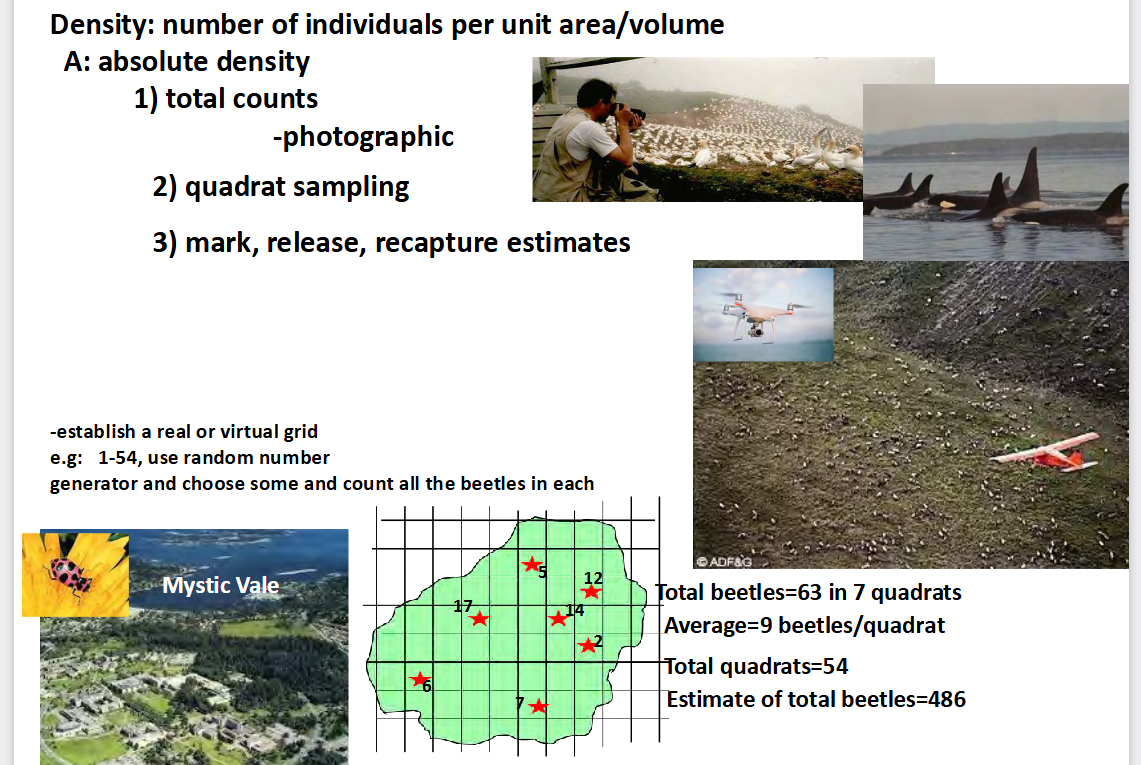
what is density? how do we measure the population density? and explain this example
Total counts: use photography or drones
Quadrant sampling: counting individuals with a small defined sample area to estimate population over a much larger area
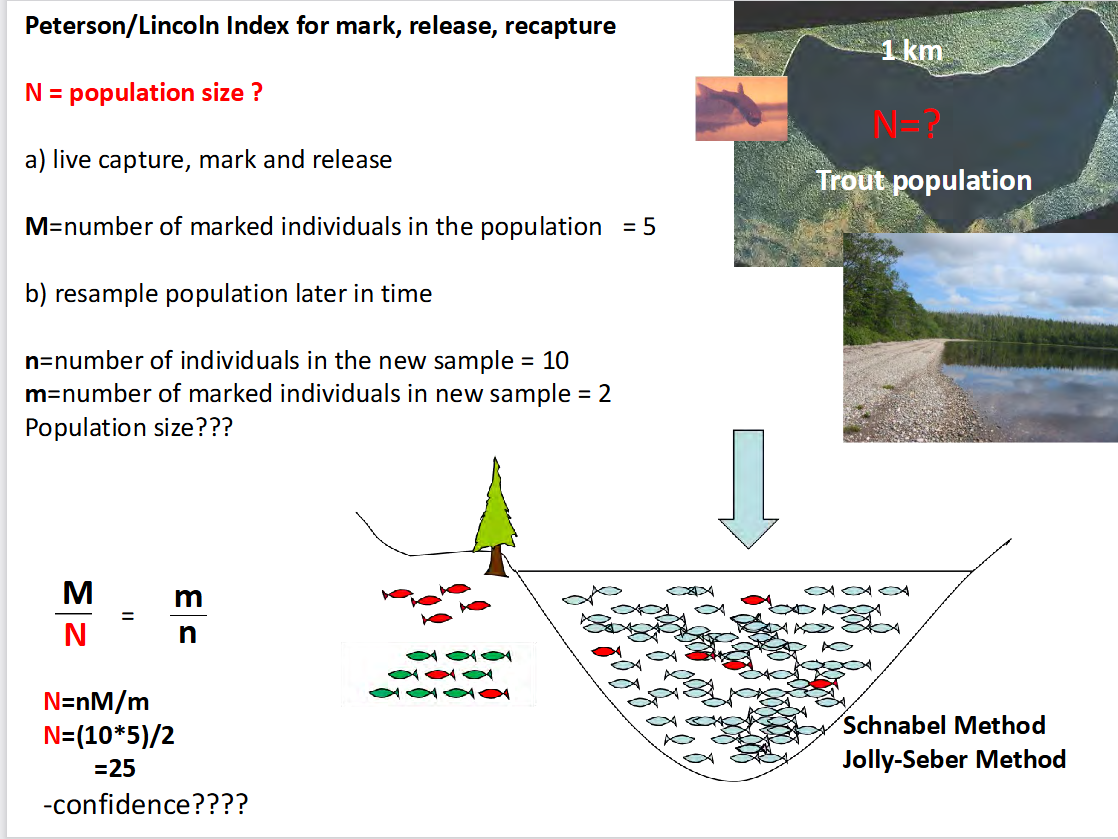
Mark, release, recapture estimates: trap a sample of animals, release them and use the ratio of marked and unmarked animals in later catch to calculate total population size.
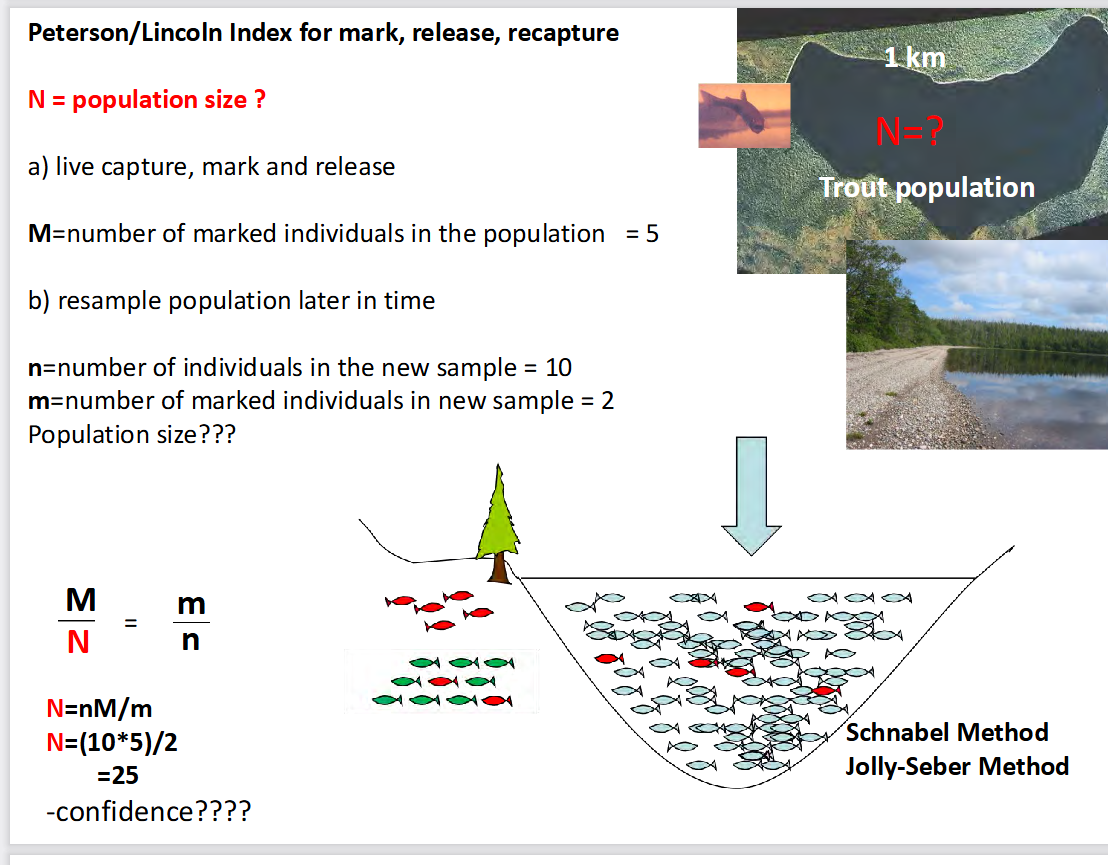
what us the Peterson/Lincoln index for mark, release and capture?
it is used to estimate the total population size (N) when its impossible to calculate every individual directly
confidence????": This refers to calculating confidence intervals. Because field sampling relies on chance, smaller sample sizes (like capturing only 2 marked fish) yield low statistical confidence and high margins of error.
The fundamental assumption is that the proportion of marked individuals in the second sample is exactly equal to the proportion of marked individuals in the entire total
The method relies on tracking individuals across two separate sampling periods:
Mcap M
𝑴= 5 → Initially Marked Individuals: In the first step (a), 5 trout are captured, tagged/marked, and released back into the lake.
𝒏= 10 → Total Second Sample Size: In the second step (b), a new group of 10 trout is captured later.
𝒎 = 2 → Recaptured Marked Individuals: Out of those 10 trout in the second sample, exactly 2 are found to carry the mark from the first session.
𝑵= ? → Total Population Size: The unknown total number of trout living in the lake.
Then we assume that the number of marked fish is proportional to the population of the entire lake
The Schnabel method is used for multiple consecutive rounds of marking and recapture
Jolly-Seber method accounts for open populations where individuals are actively being born, dying, migrating in, or migrating out.
list the 5 assumptions for reliable population estimates in mark-recapture studies
The population N is largely constant over the duration of the mark-recapture studies
marked individuals have the same chance of getting caught as unmarked individuals
Marked individuals do not incur greater mortality as a result of the capture or mark
marked individuals do not lose their marks
Non-invasive methods using genetic markers (genetic fingerprinting)
what are 5 essential assumptions for reliable population estimates in mark-recapture studies? talk about them
The population N is largely constant over the duration of the mark-recapture studies
no inmigration, deaths or births
only possible in a short time frame
marked individuals have the same chance of getting caught as unmarked individuals
Marked individuals do not incur greater mortality as a result of the capture or mark
stress related mortality
mark associated mortality (increased visual contrast and susceptibility to predation, or infection
marked individuals do not lose their marks
Non-invasive methods using genetic markers (genetic fingerprinting)
collect hair, feather, faeces, cales, identify individual genotypes

talk about the slide of life table construction - demography
Life tables: help estimate mortality rates, survival rates, survivorship curves and average life expectancy
there are 2 types: age specific and time specific

talk about age specific (cohort) analysis:
we follow a specific cohort from birth to death
most useful on short lived species (mices, songbirds)
Ecologists take these real field numbers—specifically looking at how survivorship drops drastically from 60% down to 6% during the recruitment phase—to map out the species' overall life expectancy and survival strategies.

talk about time-specific life tables? what do the use to repsent the age distribution snapshots?
They sample the population on a specific day or year and determine how many individuals currently exist in each age class
age structure at a single point in time of an entire population
long lived animals - static life table
requires age distribution of a population - find a way to age the animals like counting growth rings on horns
This chart shows population pyramids, which are the exact age distribution snapshots required to construct a time-specific (static) life table.

how do ecologists determine the age of organisms in the field?
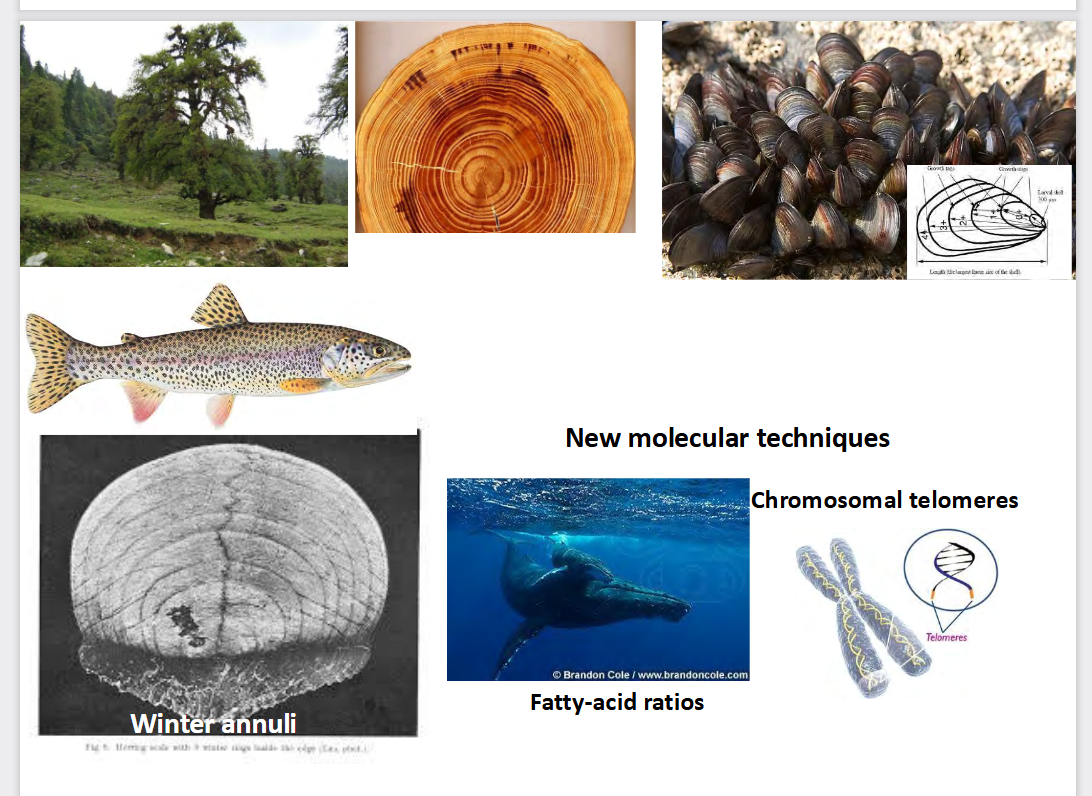
This slide illustrates physical and molecular methods used by ecologists to determine the age of organisms in the field.
growth rings: trees, mussels, fish scales
New molecular techniques:
chromosomal telomeres: they are at the end of DNA strands and shorten everytime a cell divides
fatty acids ratios: certain fatty acids accumulate or breakdown over a lifespan and can work as a biochemical clock
talk about the Dall mountain sheep
by Adolph Murie in 1937
he aged them all based on the rings of their horns

how can we calculate qx, the age specific mortality rate?
its the proportion of animals that die during the age interval

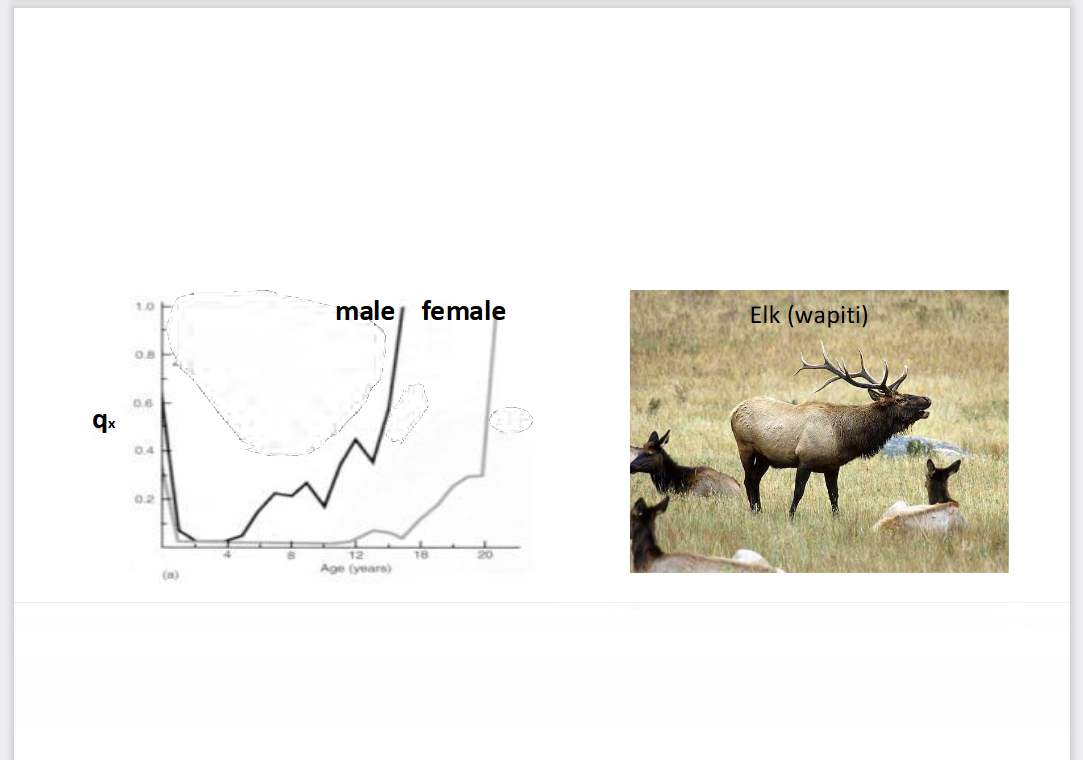
Why Do Male Elk Die So Much Sooner?
Why Do Male Elk Die So Much Sooner?
The drastic difference in mortality during their prime years is driven by behavioral and reproductive costs:
The Rut (Mating Season): Bulls spend massive amounts of energy fighting other males, defending harems of females, and bugling. They often stop eating during this period.
Winter Vulnerability: Because bulls enter the harsh winter completely exhausted and underweight from the rut, they suffer much higher rates of starvation and winter mortality.
Predation: Weakened, lone bulls are primary targets for apex predators like wolves and grizzly bears compared to females who stay protected within large herds.
what is ex?
life expectancy: expected number of additional years of life remaining at any specific age
The top graph (Survivorship): it shows how many individuals out of the original group are still alive at each age. It starts at 100% of the babies and drops as sheep die off over time.
The bottom graph (Life Expectancy):shows how many more years a sheep can expect to live, given the age it has already managed to reach.
A Quick Example to See the Difference:
Look at Age 10 on both graphs.
Top Graph: Tells us that only about 25% of the original sheep are still alive at age 10.
Bottom Graph: Tells us that for a lucky sheep that actually makes it to age 10, it can expect to live an average of 1.3 more years.


what are the 3 main types of survivorship curves in ecology?
Type 1: High survival rates throughout early and middle life. Mortality strikes heavily only at the end of the maximum lifespan. Few offpsring and extensive care
Type 2: An individual faces a constant probability of dying at any age. Mortality is driven heavily by random environmental threats like weather, disease, and steady predation. Many birds
Type 3: Massive mortality right at the beginning of life. The vast majority of babies die immediately, but the very lucky few that manage to survive early childhood have a high chance of living a long time. These species produce thousands of offspring all at once and provide zero parental care


explain what type of curve is this
Type 3
graph one has a lot of babies, so that they can ensure their population that they will have trees in the future.
The major browsing of trees by deers has increased the babies mortality rate. The only trees that survive were the ones that were mature before the deers browsing.

is the population increasing, decreasing or stable?
its stable! You have lots of babies, most die, the ones that survive get to grow to be mature and then when they are older they die.
predicting total population size over time: whats the formula? what are the 4 primary population parameters?
Nt+1 = Nt + B - D - E
Nt: # of individuals alive right now (current time)
Nt+1: the predicted population size in the next time step
4 parameters:
Births: fecundity (# of offspring produced) and fertility (ability of female to produce offspring)
Deaths
Immigration
Emigration

whats Age-Specific Fecundity rate and total fecundity rate? is the human population growing with this information?
1. Age-Specific Fecundity Rate (ASFR): The average number of offspring produced by a single female within a specific age bracket.
The Example: The text list next to the pyramid shows mock birth rates for women at different life stages (e.g., peak reproduction is shown at ages 25–29 with an ASFR of 0.7).
2. Total Fecundity Rate (TFR): The average number of total offspring a female is expected to produce over her entire lifetime.
Cant tell, this ASFR and TFR tell us nothing about death, imigration or emigration
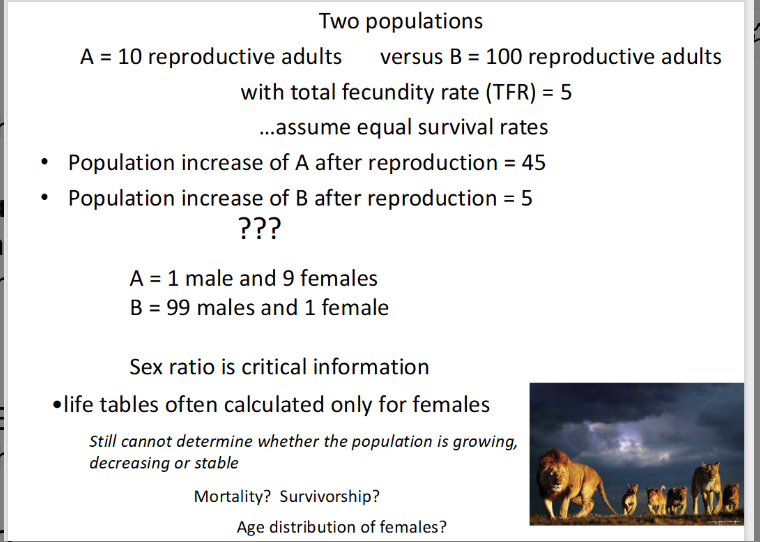
what does this slide want to tell us?
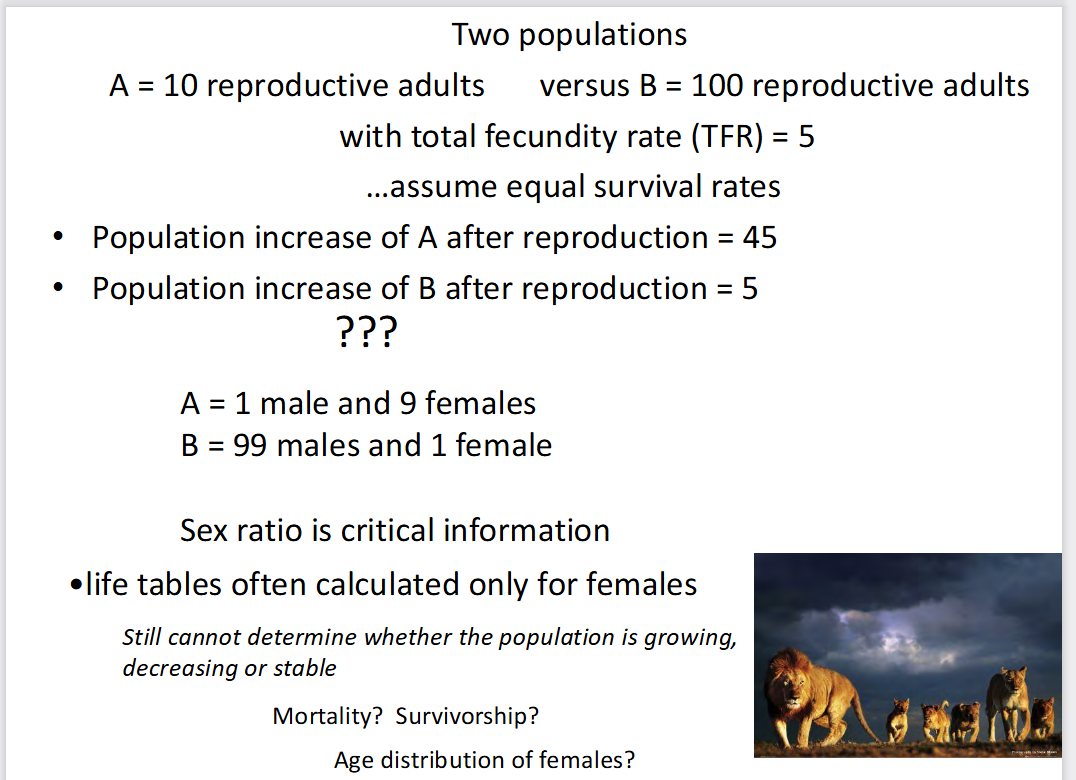
This slide demonstrates that the number of females in a population (sex ratio) is a critical factor driving population growth, rather than just the total number of adults.
Even though Population B has 10 times more total adults than Population A, it produces drastically fewer offspring because it is severely limited by having only one female. In most wildlife species, a single male can mate with multiple females, making females the true engine of population growth.
how do we calculate the net productive rate R0??
R0: the average number of daughters that will be produced by each female in the population
in her lifetime
R0 = (lx)(mx) = survivorship * number of daughters for each age class
lx= survivorship: number of females surviving to beginning of age interval x divided by the numbers born
mx = average number of daughters produced by each age class of females
R0 < 1, population is decreasing: on average, each female produces less than one breeding
daughter by the end of her reproductive life
R0 = 1: population is stationary: on average, each female produces more than one breeding
daughter by the end of her reproductive life
R0 > 1: population is increasing: population will grow to 133 females per generation

whats the formula for geometric population growth?
Nt+1 = R0* Nt
Nt = current population size
R0= the net reproductive rate, how many daughters does each female leave behind
Nt+1 = the population size for the next generation/year

what do we do if a net reproductive rate (R0) is unknown?
use lambda inver y
lambda is the geometric rate of increase
y = Nt+1/Nt
good for semelparous species, usually short lived

what do we do if a net reproductive rate (R0) is unknown and its for iteroparous species?
For iteroparous species (most plants, most vertebrates, many invertebrates), population growth
after reproduction is predicted by continuous rather than discrete growth
dN/dt = rN
dN = change in numbers
dt = change in time
dN/dt = rate of population increase
N = population size
r = per capita rate of population growt = birth rate (b) - death rate (d)

what is an alternative method for estimating r besides birth rate - death rate?
r = loge R0 /Tc
Tc = generation time, mean of age of female at birth of her offspring
R0 = net reproductive rate

what are the rules for r?
If r is < 0, population declines
If r = 0, population is stable
If r is > 0, population increases
To determine actual population (N) at some point into the future (t) for a population with overlapping generations


populations cannot grow indefinitely:
finite resources ran out, renewable resources are limited
K = carrying capacity
how can we determine how many animals can be sustained in a habitat in the long term?

what is K?
The maximum population size an environment can sustainably support. I

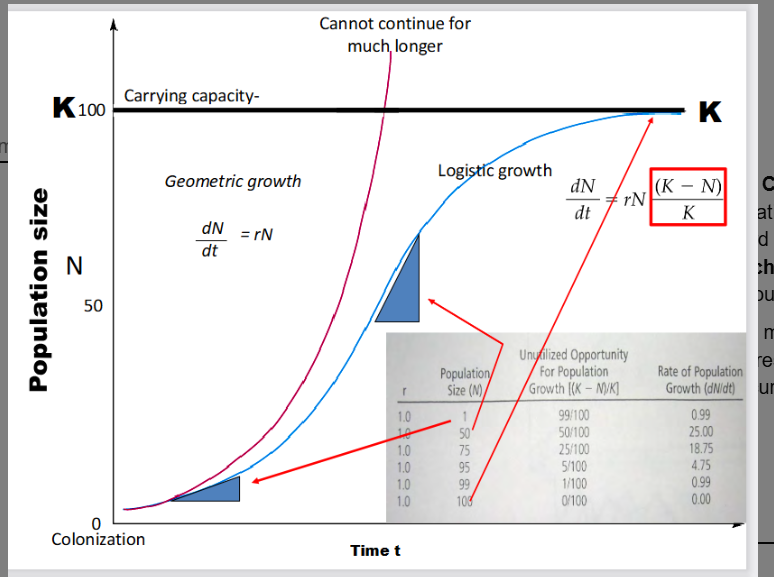
explain
1. The Core Curves
Geometric (Exponential) Growth (Pink Curve): This occurs when resources are unlimited. The population grows at a constant rate (𝑑𝑁𝑑𝑡=𝑟𝑁), shooting upward in a J-shape. As the text notes, this cannot continue for much longer in the real world because resources eventually run out.
Logistic Growth (Blue Curve): This is a more realistic model. Growth starts quickly but slows down as resources become scarce, creating an S-shaped (sigmoid) curve that levels off at the Carrying Capacity (K)
dN/dt = (rN (K-N))/K

life tables without fecundity data are useful for determining each of the following except
a. average life expectancy
b. mortality rates
c. survivorship curves
d. population growth
e. survival rates
d

2
formula summary:

list the 4 types of variation in logistic growth in nature:
ideal logistic (smooth response): not common in nature
damped oscillations
stable limit cycle
chaotic
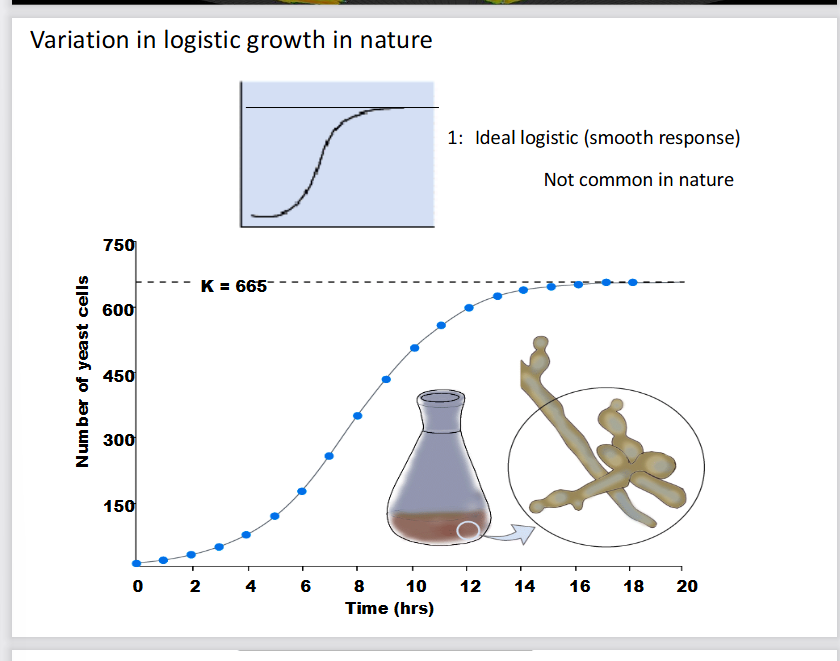
what is logistic population growth type 1. Ideal logistic?
this is an experiment of yeast cells growing in a flask.
The Carrying capacity is 665: Growth stops here because resources like nutrients and space become limited.
what is logistic growth in nature type 2. damped oscillations
when a population fluctuates around its carrying capacity (k) before stabilizing.
what us the type 3 of variation stable limit cycle
a population growth variation where a population consistently rises and falls in a regular, predictable pattern around its carrying capacity (K) instead of stabilizing
constant amplitude and period
caused by predator-prey relationships

what is the fourth type of variation in logistic growth in nature: chaotic
where a population completely overshoots its environmental limits, severely damages its resource base, and crashes precipitously.
carrying capacity K of the habitat is influenced by….
the most limiting resource
what is the control mechanism of population size?
density-dependent population regulation!
this is driven by intrinsic factors, depending on activity of individuals (birth rate, death rate)
when population is too dense, they decrease birth rates and increase mortality rates
what are the three main graphical models of density-dependent population regulation?
Regulation of increased mortality
Regulation by decreased births
Regulation by both

when population exceeds K, what are the A) mechanisms for density-dependent effects (list them)
Intraspecific competition
Delayed breeding or reduced offspring production
territoriality
Dispersal
Parasites/diseases
predators
for 1. intraspecific competition involves?? whats interference competition?
occurs when required resources sch as food, space or mates are in limited supply
Interference competition- individuals directly interfere with others for limited resources
-gulls stealing from others, lions excluding others from a kill, etc

for 2. delayed breeding or reduced offspring production??
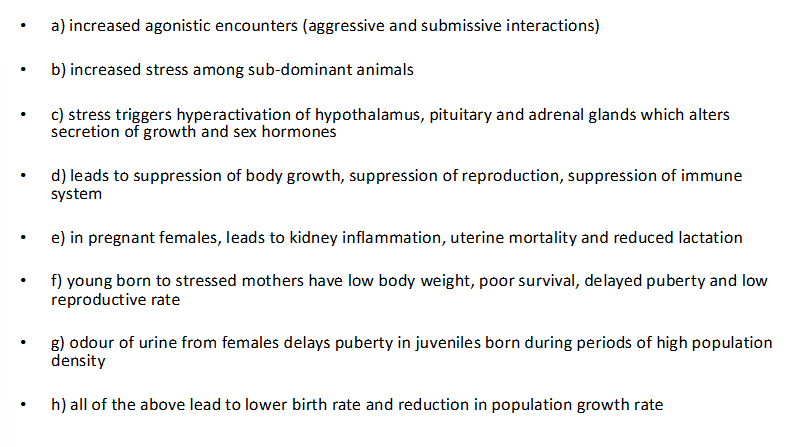
general mechanisms of birth rate reduction and population regulation at high population densities:
for 3. territoriality??
animals maintain larger territories when resources become limiting
subdominant individuals have reduced access to resources when dominant individuals manage the large territory
leads to reduction in numbers of non-territorial individuals (reduced reproduction)
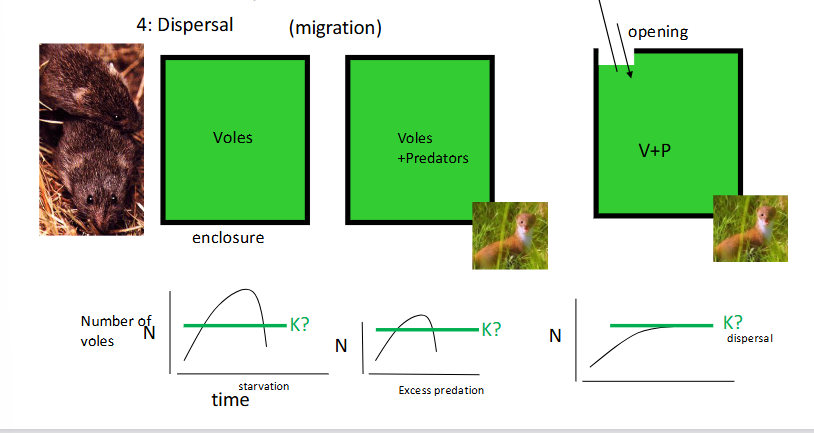
for 4. dispersal??
this has to do with migration
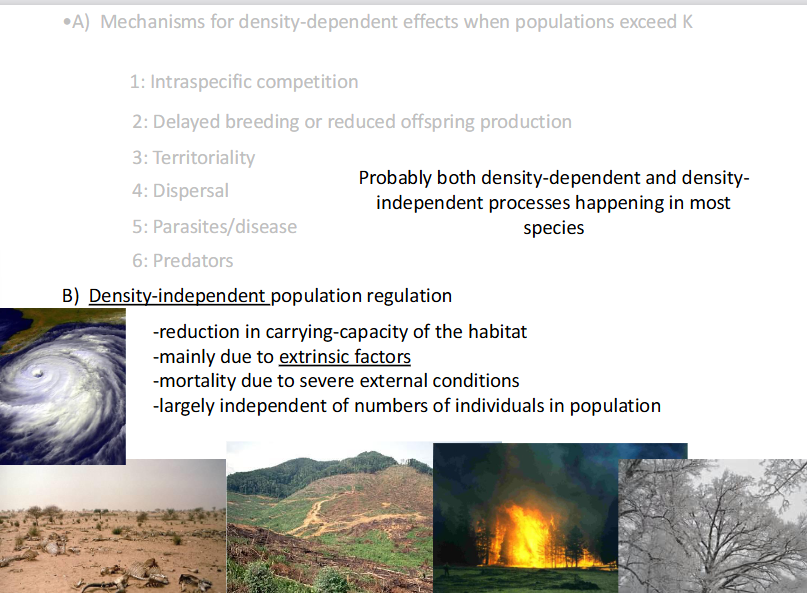
when populations exceed K, what are B) mechanisms for density independent population regulation?