L10: Introduction to Raman Spectroscopy
 Call Kai
 Learn
Learn Practice Test
 Spaced Repetition
 Match
Match Flashcards
 Knowt Play
1/20

There's no tags or description
Looks like no tags are added yet.
Name | Mastery | Learn | Test | Matching | Spaced | Call with Kai | Chat |
|---|
No analytics yet
Send a link to your students to track their progress
21 Terms
Raman Spectroscopy discovery and main idea
In 1928 C. V. Raman discovered that the wavelength of a small fraction of the radiation scattered by molecules is different from the incident of radiation, and is usually shifted to lower frequencies
signals are usually very weak; about % of the incident laser radiation → must be separated from raleigh scattering
How are weak Raman signals overcome
FT (Fourier Transform) techniques → improve signal processing and resolution.
Powerful lasers → generate more scattered photons.
Sensitive visible–NIR detectors
How are Raman Spectra acquired
Laser excitation: Raman spectra are acquired by irradiating the sample with a strong visible laser, mostly Rayleigh scattering but a small amount of Raman scattering
Scattered radiation measured at 90 degrees: detector is typically placed at 90 degree angle to the incoming laser beam
Excitation eavelength is chosen carefully to avoid fluorescence produced by laser light
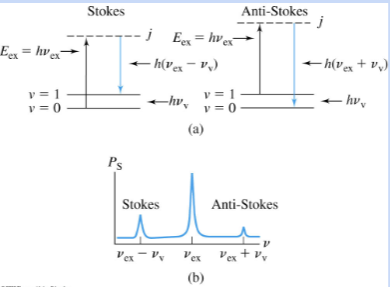
Raman Diagrams
Resonant absorption
molecule absorbs energy matching an electronic transition and emits radiation corresponding to the energy difference between electronic levels, producing fluorescence or phosphorescence
Rayleigh scattering
molecule is excited to a virtual state and returns to its original state, emitting a photon with the same energy as the incident light.
Stokes scattering
The molecule reaches a virtual state and loses energy, emitting a lower- energy photon that appears as a Stokes line on the red side of the incident beam.
Anti-Stokes scattering
molecule gains energy from vibrational states and emits a higher- energy photon that appears as an anti-Stokes line on the blue side of the incident beam
Advantages of Raman Spectroscopy
Raman is a scattering effect and does not have to result in vibrational transitions
Raman requires a change in polarizability of the bond; often, Raman-activebands are IR-inactive, and vice versa
Raman can also operate in water and through conventional optical materials, unlike IR spectroscopy, which must use crystalline halides (NaCl and KBr)
Components of Raman Spectrometers
Excitation source
Sample light and collection optics
Wavelength selector
Detector
Signal processor
Display

Notch (interference) filters
Remove Rayleigh scattering by blocking wavelengths within ±80–120 cm⁻¹ of the laser line.
However, this could prevent detection of low-frequency Raman modes within that range
Holographic gratings
Commonly used in Raman spectrometers because they have fewer defects and produce much less stray light than ruled gratings
Multiple dispersion stages
Double- and triple-stage spectrometers further reduce stray light and allow detection of low-frequency Raman signals (~3–5 cm⁻¹) without notch filters
Raman Sampling in Gases

Raman Sampling in Liquids

Raman Spectroscopy in Solids

Excitation Sources in Raman Spectroscopy
Lasers are commonly used; Raman intensity increases with excitation frequency, but high-energy sources may cause photodecomposition.
Lower-energy excitation reduces fluorescence but decreases Raman intensity
FT techniques improve signal-to-noise ratio (SNR)
analyte concentration
Raman intensity is proportional to
Fiber Optic Multi Channel Raman Spectrometers

FT Raman Spectrometer

Handheld and Standoff Raman Spectrometer
