Microeconomics (ch 5-7)
 Call Kai
 Learn
 Practice Test
 Spaced Repetition
 Match
 Flashcards
 Knowt Play
1/58

Earn XP
Description and Tags
for midterm #2
59 Terms
price elasticity of demand
how responsive consumers are to a change in price (always positive)
Ed= (percent change in quantity demanded)/(percent change in price)
elastic demand
(Ed>1) consumers are highly responsive to a change in price. A small increase could cause a sharp drop in sales, usually because there are other substitutes. (ex. water bottles, baby wipes)
inelastic demand
(Ed<1) consumers are insensitive to price changes. Consumers will still demand a lot despite an increases in price, usually because substitutes are difficult to find (ex. gas, special drugs, spices)
unit elastic demand
(Ed=1) Ex. shoes, cars, salons
Cross elasticity of demand
measure how a change in the price of good B affects demand for good A (signs matter). Determines whether something is a substitute or a complement
Eab= (percent change in quantity demanded of product A)/(percent change in price of product B)
substitutes
(Eab>0) in increase is price of B increases demand for A, but brand loyalty can affects (like cars for example).
(ex. chicken/turkey, AT&T/Verizon, Fiji/Dasani)
complements
(Eab<0) an increase in price of B decreases demand for A (coffee/creamer, burgers/fries, sausage/hotdog bun)
income elasticity of demand
how responsive quantity demanded is to changes in consumer income. Sign determines whether something is a normal good, luxury good, or inferior good.
(Ey= (percent change in quantity demanded)/(percent change in income)
normal goods
(0 < Ey < 1) as income rises, demand increased. (ex. clothes, food, etc.)
luxury goods
(Ey >1)A type of normal good, as income rises, demand for the good sharply increases (ex. jewelry, fine dining)
inferior goods
(Ey < 0) as income rises, demand decreases, usually to choose higher-quality options (ex. instant noodles, budget motels, generic soda)
price elasticity of supply
measure responsiveness of quantity supplies to price changes (always positive)\
Es= (percent change in quantity supplied)/(percent change in price)
Elastic: (Es>1) usually mass produced elastic goods and digital goods
Inelastic: (Es<1) usually crops, natural resources, mining
Unit elastic: (Es=1)
Market periods explain the lag between the popularity of a good and when its inventory can be replaced (ex. crops have longer market periods because its harder to grow more crops fast)
Tax incidence and burden
refers to who bears the ultimate economic burden of a tax (depends on elasticity)
Types of taxes
Progressive taxes, flat taxes, regressive taxes, lump-sum tax (type of regressive tax that takes a fixed amount of money), and excise taxes (placed on a specific typed of good and is usually included in the price of a good because producers pay it)
Mid point formula
used to calculate the price elasticity between two points (always positive)
Ed= (%△Q)/(%△P)
(%△Q)= (Q2 - Q1)/ ( (Q2 + Q1) /2)
(%△P)= (P2 - P1)/ ( (P2 + P1) /2)
total revenue test
(TR = P * Q) (total units sold times price of each unit) total output depends on price changes and elasticity
Inelastic demand: price and total revenue move in the same direction. (price increase raises TR)
Elastic demand: price and revenue move oppositely. (price increase lowers TR)
Unit elastic: price changes don’t affect TR
Elasticity along a linear demand curve
Elastic in the upper left: TR keeps rising until equilibrium is reached. Inelastic in the lower right: TR starts falling after equilibrium.

Tax Burden Rules (demand elasticity)
Inelastic demand shifts tax burden onto consumers. Because they are willing to pay more, produces can afford to raise prices to cover the tax.
Elastic demand shifts tax burden onto producers. If producers raise prices too much to cover the tax, consumer will stop buying.
Tax Burden Rules (supply elasticity)
Inelastic supply shifts tax burden onto producers. Producers can’t easily change production rates or shift resources, to accommodate a tax
Elastic supply shifts tax burden onto consumers. Producers can easily produce more/less or use their resources elsewhere, leaving consumers to deal with the tax.
Deadweight loss
the loss of total welfare when market is not at equilibrium
The greater the elasticity, the greater the deadweight loss from (especially from a tax)
Determinants of Demand elasticity
Substitutability: goods with many substitutes have elastic demand
Proportion of income: goods representing a larger portion of a budget (ex. housing) are more elastics compared to smaller parts of budget (ex. salt)
Luxuries vs. necessities: luxuries are elastic, necessities are more inelastic
Time period: the longer time you have to adjust your consumption patterns, the more elastic; the less, the more inelastic.
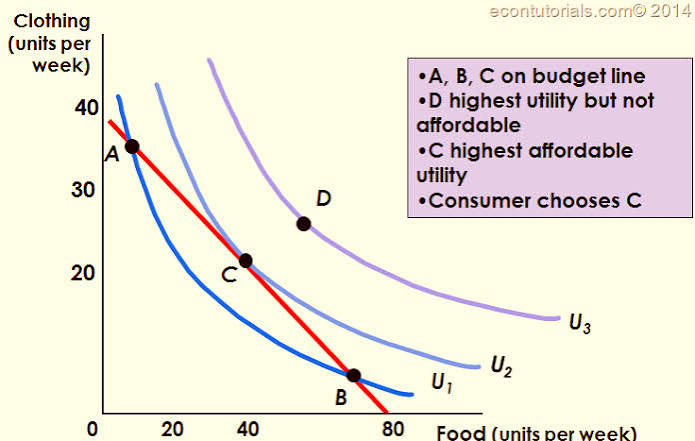
budget line
graph showing all the possible combinations of two goods a consumer can purchase with a fixed income and fixed prices
marginal utility analysis
how can you maximize consumer satisfaction?
Utility
a hypothetical measure of consumer satisfaction (measured in utils)
Total utility
cumulative satisfaction derived from consuming a specific total quantity of a good
marginal utility
the additional satisfaction gained from consuming one additional unit of a good
law of diminishing marginal utility
states that as we consume additional units, our marginal utility (the rate at which our satisfaction increases with each additional unit) begins to decline
utility maximizing rule
total utility is maximized where marginal utility per dollar is equal for all products
(MUa / Pa) = (MUb / Pb)
behavioral economics
integrates psychology into economic models to explain why some individuals make decisions that deviate from standard predictions
Budget line dynamics (price and income changes)
Price changes: a price change of one good pivots the budget line along that good’s axis (inward on the axis if price increases, outward if price decreases)
Income changes: an increase in income shift the line outward (parallel), a decrease shifts it inward.

Indifference curve
a curve displaying all combinations of two goods to which the consumer is indifferent (the receive the same level of satisfaction)
these curves have negative slopes and are bowed inward
optimal consumer choice
consumer satisfaction is maximized at the point where the highest achievable indifference curve touches the budget line
Five psychological factors influencing economic decisions
Sunk Cost Fallacy: allowing past, uncoverable costs influence you current choices rather than evaluating current marginal benefits (ex. going to a concert you paid for months ago rather than studying for an exam tomorrow)
Framing bias: being influenced by how choices/ prices are presented (ex. $2.99 vs $3.00 or BOGO free vs. 50% off entire purchase)
Overconfidence: overestimating future behavior vs capabilities (ex. buying an expensive gym membership that goes unused because you overestimated your ability to follow through
Overvaluing the present relative to the future: prioritizing immediate gratification over superior long-term benefits
Altruism: acting out of care for other without direct benefit (ex. generous tips)
Firm
an economic institution that transforms resources (inputs) into outputs. They must determine market need then decide what quantity of output to produce, how to produce it, and what inputs to use
Sole proprietorship
(most basic, easy to manage) a single owner supervises and manages the business and is subject to unlimited liability
partnerships
two or more owners sharing management and division of labor, subject to unlimited personal liability
corporation
owned by shareholders with less direct control from the owners. offers limited liability.
profit
total revenue (TR) minus total cost (TC)
total revenue
money a firm receives from the sales of its products
total cost
out-of-pocket expenses and opportunity costs
economic costs
explicit costs (expenses paid directly to another economic entity like wages, taxes, materials, etc) plus implicit costs
accounting profit
TR - explicit costs
economic profit
TR - (explicit + implicit)
normal profit
an economic profit of zero. sufficient to keep investors satisfied in the business over the long run
short run
a period over which at least one factor of production is fixed (ex. plant capacity)
long run
a time period long enough that all inputs can be adjusted and firms can enter/ exit the industry
Total product
total product produced by an amount of labor (used to change output in the short run where plant capacity is fixed). Experiences diminishing returns
marginal product
additional output produced by adding one more unit of labor
MP= (△Q/ △L)
average product
output per unit of labor. it’s subject to diminishing marginal returns.
(AP = Q/L)
Total costs
fixed costs (FC) + variable costs (VC)
variable examples: labor, materials
fixed examples: rent, insurance premiums
marginal costs
change in total cost from producing one additional unit. It’s curve passes through the minimum points of the AVC and ATC curves
MC= (ΔTC)/ (ΔQ)
average fixed cost
total fixed costs divided by output. Continually falls as output increases
AFC= (FC)/ Q
average variable cost
labor and materials expenses that goes into each unit. Is U-shaped, meaning it has initial increasing returns then diminishing returns.
AVC= (VC)/ Q
average total cost
provides a general measurement of productivity. Is U-shaped, meaning it has initial increasing returns (spreading effect) then diminishing returns.
ATC= (TC)/Q
aka
ATC= AFC + AVC
long run average total cost
shows the lowest unit cost for output levels produced in the long run when a firm can adjust its plant size. decreases as firm’s output increases
economies of scale
as a firm grows, its LRATC decreases because of specialization of labor and management and efficient capital use
constant returns to scale
as a firms output increases, LRATC remains constant (ex. fast food costs the same to produce almost anywhere)
diseconomies of scale
LRATC increases as a firm grows too big, usually because of management, coordination, and resource scarcity
economies of scope
by producing interdependent product lines, firms can produce them at lower costs. (ex. Unilever’s or Procter & Gamble’s household products