Ecology Unit 2
 Call Kai
 Learn
 Practice Test
 Spaced Repetition
 Match
 Flashcards
 Knowt Play
1/111

There's no tags or description
Looks like no tags are added yet.
112 Terms
R-selected
“fast organisms;” organisms that grow quickly, reproduce early, produce many offspring, and invest relatively little in each offspring
K-selected
“slow organisms;” organisms that mature later, produce fewer offspring, invest more heavily in them, and tend to live longer
life history
resource allocation across a lifetime
frequency/intensity, resource availability
the two axes of Grime’s CSR model are ___ and ___
Grime’s CSR model
two-axis framework that asks what environmental problem an organism is adapted to solve
competitor, stress-tolerator, ruderal
the three strategies described by the CSR model
competitor
“capture and crowd” strategy
stress-tolerator
“save and survive” strategy
ruderal
“race to reproduce” strategy
productivity
the rate of biomass production
low productivity
at ____, only stress-tolerant species persist
high productivity
at ____, strong competitors or ruderals under high disturbance can dominate and exclude others
intermediate productivity
at ____, a variety of strategies can coexist
36
in the park grass experiment, the starting richness at zero added resources was about __ species
3
in the park grass experiment, each additional resource corresponded to a decline of about __ species
0.49, 49
in the park grass experiment, R² = __; about __% of variation in richness was explained by number of added resources
high-productivity
in the park grass experiment, the plots began as fertile agricultural land, so this represents the ____ side of the broader relationship
habitat complexity, species diversity
habitat structural diversity demonstrates a positive relationship between ___ and ___
foliar height, bird
MacArthur’s work linked greater ____ diversity to greater ___ diversity because more vertical structure creates more nesting, foraging, cover, and prey-use opportunities
disturbance
removes biomass or damages individuals through processes such as fire, floods, storms, grazing, or herbivory
intermediate disturbance hypothesis
predicts that species richness is greatest at intermediate disturbance
low disturbance
strong competitors dominating and competitively excluding other species is the expected community outcome of a ____ level (competitors win)
intermediate disturbance
neither competitive dominants nor disturbance specialists completely dominating is the expected community outcome of a ____ level, where coexistence is highest
high disturbance
only rapid colonizers / ruderals persisting reliably is the expected community outcome of a ____ level (ruderals win)
direct effect
species A acts directly on species B
indirect effect
species A affects species C through one or more intermediates
density-mediated indirect effect
species A changes the abundance of intermediate species B, which changes C
trait-mediated indirect effect
species A changes B’s behavior or traits, which changes C without necessarily changing B’s abundance
keystone species
species that has a disproportionately large effect on community structure relative to its abundance
Paine’s sea star experiment
in ____, removing sea stars allowed competitive dominants to expand, causing species richness to collapse
keystone predator
dominant competitors can be suppressed by the presence of a ____
bottom-up control
effects propagate upward through trophic levels (food pushes upward)
top-down control
alternating effects cascade downward through trophic levels (predators push downward in a cascade)
population
consists of all individuals of one species occurring together in space and time
habitat availability, biotic interactions, dispersal
population distribution is shaped by ____, ____, and ____
geographic range
spatial extent over which a species occurs
cosmopolitan species
broadly distributed over a large geographic range
endemic species
restricted to a particular region or specific habitat conditions
abundance
total number of individuals in a population (how many)
density
number of individuals per unit area or volume (how many per space)
dispersion
observed spatial pattern of individuals within the population
clumped dispersion
individuals aggregated in patches; often caused by social behavior, vegetative reproduction, or patchy resources

random dispersion
no predictable spacing; requires relatively homogeneous habitat plus random establishment

even dispersion
individuals maintain similar spacing; often associated with territoriality, competition, or home ranges

dispersal
movement to a new location where the individual remains
migration
repeated or seasonal movement with return
cohort
a ____ life table follows a group of individuals born at the same time from birth to death of the last individual
static
a ____ life table quantifies the survival and fecundity of all individuals in a population during a single time interval
B
which population, A or B, is poised to continue experiencing positive population
growth?

I
which curve, labeled I, II, or III, reflects likely survivorship patterns for large mammals?

II
which curve, labeled I, II, or III, reflects likely survivorship patterns for small mammals and birds?

III
which curve, labeled I, II, or III, reflects likely survivorship patterns for turtles, fish, and plants?

geometric
Nt = N0λt, the equation for the ____ growth model, is used for population growth that occurs in distinct, non-overlapping steps or generations
geometric
doubling time=ln(2)/ln(λ) for the ____ model
exponential
Nt = N0ert, the equation for the ____ growth model, is used for population growth that occurs continuously in real time, with overlapping generations
dN/dt=rN
differential form (rate of change) for exponential growth
exponential
doubling time=ln(2)/r for the ____ model
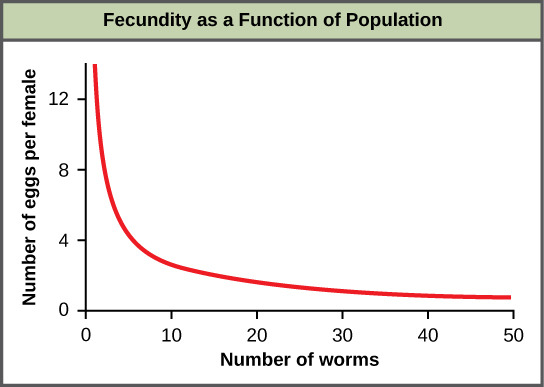
fecundity
number of offspring an individual will produce during reproductive episodes
parity
number of reproductive episodes an organism experiences
trophic cascade
indirect effects initiated by a predator
ruderals
have the fastest growth rate
competitors
have a fast growth rate
stress-tolerators
have a slow growth rate
stress-tolerators
allocate the most energy to defense
competitors
allocate less energy to defense
ruderals
allocate the least energy to defense
ruderals
sexually reproduce the most
competitors
sexually reproduce less
stress-tolerators
sexually reproduce the least
environmental stress, resource scarcity
at low levels of resource availability, species richness is limited by ____ and ____
resource availability, ecological interactions
at moderate levels of resource availability, species richness reaches its maximum because of a balance between ____ and ____
competitive exclusion
at high levels of resource availability, species richness declines sharply due to ____
low
____ levels of disturbance allow competitive exclusion to take over
high
____ levels of disturbance cause high mortality, which resets community development continuously
competitive exclusion
strong, fast-growing, or competitively dominant species monopolize essential resources, driving weaker species to extirpation
negative density-dependent growth
per capita growth rate of a population decreases as the population size or density increases
resource competition
one cause of negative density-dependent growth
positive density dependence
the circled segment of the curve indicates ____

negative density dependence
the bracketed segment of the curve indicates ____

mate availability
one factor that leads to positive density dependence
all the same
in a Basic Metapopulation Model, the level of variation in habitat suitability among patches is ____
all the same
in a Basic Metapopulation Model, the level of variation in subpopulation sizes is ____
all the same
in a Basic Metapopulation Model, the potential for individuals to migrate to any particular subpopulation is ____
varies
in a Landscape Metapopulation Model, habitat suitability among patches ____
vary
in a Landscape Metapopulation Model, subpopulation sizes ____
distance from other patches, matrix quality
in a Landscape Metapopulation Model, the potential for individuals to migrate to any particular subpopulation depends on factors like ____ and ____
sink populations
inhabit poor quality habitats which cannot support a large enough growth rate for the population to persist
source populations
inhabit high quality habitats
source, sink, sink
immigration rates from ___ to ___ are higher than emigration rates, which offsets population decline and allows the ___ population to persist
source, sink
individuals from ___ populations must emigrate to ___ populations when the amount of per capita benefit in their habitat gets lower
death, birth
in sink populations, ___ rates exceed ___ rates
birth, death
in source populations, ___ rates exceed ___ rates
larger, less isolated
occupied patches tend to be ___ and ___
small, small
___ populations in ___ patches are highly vulnerable to dying out from random occurrences like extreme weather, disease, or fluctuating birth rates
large, large
___ populations in ___ patches can easily absorb random shocks, leading to a much lower rate of extirpation
resources, habitat diversity
large patches provide more ___ and ___
immigration
patches that are less isolated experience significantly higher rates of ____, which prevents the patches from becoming empty
genetic diversity, finding mates
in smaller, isolated patches, there is less ____ and increased difficulty ____
exponential growth
the blue line depicts ____

logistic growth
the red line depicts ____
