Presentation and Display of Quantitative Data: Graphs and Tables
 Call Kai
 Learn
 Practice Test
 Spaced Repetition
 Match
 Flashcards
 Knowt Play
1/4

There's no tags or description
Looks like no tags are added yet.
5 Terms
What are graphs used for?
Graphs are used to illustrate the findings of studies and make data easy to read. Graphs
should be simple and clear and appropriate for the data you have. Graphs should always
include an appropriate title which includes the variables of the study.
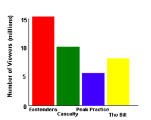
Explain bar charts
• Show data in the form of categories (discrete data) that the
researcher wishes to compare (e.g. males, females).
• The bars must be the same width and separated by a space
because the data are discrete.
• The x-axis should be labelled with categories; the y-axis should
be labelled with “Frequency” or “Number of…”
Explain histograms
• Show data where both variables follow a numbered scale
(continuous data) (e.g. time, height, test score).
• In a simple histogram the bars can be the same width; in a
complex histogram the bar widths can vary. There must be no
space between the bars because the data are continuous
• The x-axis should be labelled with numbers (or numerical
groups); the y-axis on a simple histogram should be labelled
with “Frequency” or “Number of…”

Explain Scattergrams
• Display findings of correlational studies.
• The x-axis and y-axis should be labelled with the co-variables.
• A dot/cross is plotted to indicate the value of each co-variable.
A line-of-best-fit can be drawn but is not necessary

Explain Tables
Tables are used to summarise raw data and typically include a measure of central tendency
and measure of dispersion. They should be clearly labelled and easy to read.
