Marketing Intelligence
 Call Kai
 Learn
Learn Practice Test
 Spaced Repetition
 Match
Match Flashcards
 Knowt Play
1/73

There's no tags or description
Looks like no tags are added yet.
Name | Mastery | Learn | Test | Matching | Spaced | Call with Kai | Chat |
|---|
No analytics yet
Send a link to your students to track their progress
74 Terms
What is marketing intelligence?
What does marketing intelligence encompass?
What are the two perspectives on marketing intelligence?
Marketing intelligence is a key component within marketing information that links consumers, organizations, and the public to the marketer through information which is used to:
Identify and define marketing opportunities and problems;
Generate, refine, and evaluate marketing actions;
Improve the understanding of marketing as a process and of the ways in which specific marketing activities can be made more effective.
Marketing intelligence encompasses
Managing internal knowledge management systems
The collection of new data through marketing research activities;
The analysis of customers, competitors, and market trends and developments.
Project-based approach: marketing research = projects designed to investigate specific issues
Technology-based approach: marketing intelligence = information and decision support systems (e.g., data bases, data mining)
What is the fundamental purpose of marketing research?
What are limitations of marketing research?
The fundamental purpose of marketing research is to help managers make informed decisions by evaluating the past, describing the present, and predicting the future.
Marketing research helps managers:
Monitor and reflect upon past success and failures in marketing decisions,
Describe the nature and scope of customer groups,
Understand the nature of forces that shape customer groups,
Understand the nature of forces that shape marketers’ ability to satisfy customer groups,
Test marketing mix activities,
Marketing research does not make decisions.
Rather replaces hunches, impressions or a total lack of knowledge with pertinent information.
Marketing research does not guarantee success.
Rather increases the probability of making a correct decision.
What are the three kinds of questions marketing research may help answer?
Situation analysis
Segmentation: Who buys our products? How can we describe these people?
Demand estimation: What size has the market for our product?
Environmental assessment: What do our competitors offer?
Marketing program development
Product: Which design, name, packaging is likely to be most successful?
Pricing: What price can we charge? How sensitive to price are our target customer groups?
Place: What kind of distribution channel should we use to best reach our target customers?
Promotion: Which ad copy should we run? With what frequency?
Marketing program tracking
Marketing mix activities: Did our advertising campaign reach its goals?
Customer satisfaction: Are customers satisfied with our products?
Finances: Did we make profit with our products?
Who does marketing research?
What elements does a briefing for an external supplier include?
Internal MR is a function within the company
External MR, where company-external organizations are hired to supply MR services
Background information (information on the company, its products, market situation)
Reason why (problems, failures, opportunities)
Objectives (what is the problem to be solved)
Preferred method (what data collection method or data analysis procedure is preferred)
Reporting (verbal presentation or written documentation)
Timeline (scheduling of milestones)
What are the advantages and disadvantages of internal marketing research activities?
Advantages
+ Better insights into the management problem
+ Better monitoring of marketing research activities
+ Better access to decision makers within the firm
Disadvantages
− Less developed marketing research capabilities
− Less experienced in conducting marketing research projects
− Organizational blindness leading to insufficient information handling
− Higher subjectivity
− Higher costs
What are the advantages and disadvantages of external marketing research activities?
Advantages
+ Greater knowledge about marketing research methods, techniques, and processes
+ Greater experience with similar problems and how to deal with them
+ Better measurement tools
+ Greater objectivity
+ Costs occur only when an external marketing research organization is hired
Disadvantages
− Less insights into the management problem
− Communication problems
− Potential risk of service failures
− Potential risk of indiscretion
What are the phases of the marketing research process?
Determine the research problem
Identify management's information needs, translate decision problems into research questions/hypotheses, and confirm the value of information
Select the appropriate research design
Choose a research design classification (exploratory, descriptive, or causal), determine primary/secondary data sources, design measurement tools, and establish sampling plans
Execute the research design
Collect data from respondents and monitor fieldwork for quality and accuracy
Prepare and analyze the data
Clean and organize raw data, then apply relevant univariate, bivariate, or multivariate statistical tools
Communicate the research results
Compile a clear, objective report and present key findings and actionable recommendations to managers
What does the decision of whether marketing research should be conducted depend on? (Determining the need for marketing research)
The decision of whether marketing research should be conducted or not depends on:
The nature of the decision (strategic vs. tactical)
The type of information needed
Availability of data and information: whether sufficient data already exists internally or externally
Time constraints: decision deadline allows sufficient time to conduct a research study
Resource requirements: availability of required budget, personnel, and technical capabilities
Cost-benefit ratio: value gained from the research information justifies the financial and operational costs
Situations when marketing research might not be needed:
Information is already available:existing internal or secondary data can solve the decision problem
Time frames are insufficient: decisions must be made faster than a research study can be executed
Resources are inadequate: required budget or technical capabilities are unavailable
Costs outweigh value: financial and operational costs of research outweigh its expected value or potential benefits
What are the three fundamental principles of the ICC/ESOMAR Code?
ESOMAR (The European Society for Opinion and Marketing Research) — the essential organization for encouraging, advancing, and elevating marketing research worldwide.
The ICC/ESOMAR Code on Market and Social Research sets out global guidelines for self-regulation for researchers.
Transparency: Researchers must clearly disclose what personal data is being collected, the purpose of collection, and how/with whom it will be shared
Data Protection & Privacy: Personal data must be protected against unauthorized access and never disclosed without explicit consent
Ethical Conduct & Do No Harm: Researchers must act ethically and ensure no harm comes to data subjects, nor any damage to the reputation of the research profession
Key Responsibility: researchers are required to limit personal data collection strictly to items directly relevant to the study
Management Decision Problems vs. Marketing Research Problems
Management Decision Problem: A situation where a manager is uncertain about which course of action will accomplish a specific objective.
Focus: Action-oriented ("What should we do?").
Marketing Research Problem: A situation framed around providing the information needed to solve the decision problem.
Focus: Information-oriented ("What information do we need?")
Examples of Problem Translation:
Decision Problem: Should we launch a new product?
Research Problem: Analyze sales of existing products and identify customer preferences for the new product.Decision Problem: Should we modify our advertising campaign?
Research Problem: Analyze advertising effectiveness and monitor brand awareness and brand image.Decision Problem: Shall we increase our price level?
Research Problem: Determine price elasticity and assess how price increases affect demand.
5 Steps to Identify Management's Information Needs
To clarify management's decision problems and properly translate them into research problems, researchers follow a sequential 5-step process:
Agree on the Decision Maker’s Purpose for the Research
Decision makers must decide whether the service of a researcher is needed.Researchers ask decision makers why the research is needed.
By so doing, researchers learn what the decision maker believes the problem is.
Understand the Complete Problem Situation
Conduct a situation analysis using internal and external data to gain background context and grasp problem complexity.Identify and Separate Out Symptoms: Clarify real business problems by separating them from observable symptoms.
The Iceberg Principle: Observable symptoms (e.g. loss of sales) sit above the surface, whereas the true root causes remain hidden below (e.g. a low-quality product, an inappropriate delivery system, a poor brand image, or unethical customer treatment).
Select the Unit of Analysis
Specify the target level of investigation (e.g., individuals, households, employees, or organizations), which directly influences sampling and scale development.Determine Relevant Variables
Jointly decide with decision-makers which specific variables and types of information must be measured
Define the research problem and questions
Information Focus: While a management decision problem asks what action should be taken ("What should we do?"), a research problem translates that situation into information requirements ("What information do we need?")
Scientific Reformulation: Researchers must reframe the decision problem into scientific terms to ensure a systematic, structured approach
Critical Importance: Redefining and determining the research problem is considered the most critical step in the marketing research process because it directly influences all remaining steps, including research design, measurement, data collection, and analysis
Two approaches to phrase question
Research questions specify the precise information needed to address the research problem.
General focus (low level of detailedness)
Broad inquiries aimed at overarching strategies or general performance outcomes: Do our marketing strategies need to be modified to increase customer satisfaction?
Specific focus (high level of detailedness)
Concrete, targeted inquiries focused on specific products, operational tactics, or promotional campaigns:
Do we need to change our advertising campaign for product A to better communicate customer benefits?
Do we need to change our after-sales services for product B to increase customer satisfaction?
What is a hypothesis?
Characteristics of hypotheses
A hypothesis is a yet unproven proposition or possible solution to a decision problem that can be empirically tested using data that are collected through the research process.
A hypothesis is developed in order to explain phenomena or a relationship between two or more variables.
Characteristics of hypotheses: they can be
empirically tested: through experiments or observations. It must be possible to support or refute it based on empirical evidence.
falsified: can be proven false under certain conditions
generalized: its conclusions apply beyond just a single isolated instance.
Examples
H1: Customers’ perceptions of price fairness affect their willingness to pay.
H2: The higher brand credibility, the higher customers’ repurchase intention.
H3: Price fairness and willingness to pay are related with each other.
Formulate hypotheses
Structural Logic & Scope
„If-component“ = independent variable;
„Then-component“ = dependent variable.
The more phenomena a hypothesis covers, the greater is its scope.
Adjusting Hypothesis Scope
The scope of a hypothesis reflects how many phenomena it encompasses
Increasing Scope (broadening the hypothesis):
- "Or-links" in the "If-part" - covers more situationsIf brand credibility is high OR price fairness is high, then customer repurchase intention increases.
- "And-links" in the "Then-part" - expands to explain multiple market outcomes simultaneouslyIf brand credibility is high, then customer repurchase intention increases AND willingness to pay increases.
Decreasing Scope (narrowing the hypothesis):
- "And-links" in the "If-part" - applicability is restricted to only those specific scenarios where both conditions are satisfied at the same time
If brand credibility is high AND price fairness is high, then customer repurchase intention increases
- "Or-links" in the "Then-part" - by making the expected outcome disjunctive rather than definitive, the explanatory coverage for any specific outcome is reduced
If brand credibility is high, then customer repurchase intention increases OR willingness to pay increases
Expected value of information to determine whether a research project is justified before committing time and financial resources
Questions that should have been answered at this point of time
Do we understand the decision problem?
Do we know all relevant variables?
Can we define all variables and make hypotheses regarding their relations?
Do we know what we want to know about whom, when, where etc.?
Questions that will help evaluate the expected value of information
Feasibility: Can the information be collected at all?
Novelty: Can the information tell the decision maker something not already known?
Depth of Insight: Will the information provide significant insights?
Derived Benefits: What benefits will be derived by this information?
Definition & Role of Research Design
Exploratory Research Design
The research design serves as an overall plan of the methods used to collect and analyze the data.
Exploratory Research Design
Major emphasis: Used to discover new ideas and insights, classify problems or opportunities, formulate research problems more precisely, clarify underlying concepts, and construct hypotheses.
Methodological Focus: Collection of either secondary or primary data. Relies primarily on qualitative approaches (e.g., in-depth interviews, focus groups, pilot studies) characterized by rather unstructured data formats and interpretation.
Example: Customers are dissatisfied: Which are the relevant criteria? Which attributes are relevant to customers?
Definition & Role of Research Design
Descriptive Research Design
Descriptive Research Design
Major emphasis: Designed to describe the characteristics of market phenomena or target populations, helping managers answer who, what, when, where, and how questions.
Methodological Focus: Collection of either secondary or primary data, Relies predominantly on quantitative methods (surveys, panels) using standardized questionnaires and formal statistical evaluation (structured data format and interpretation).
Example: Customer analysis: Collection of customer characteristics (age, gender, income, household size etc.) and customers’ assessment of satisfaction with products
Definition & Role of Research Design
Causal Research Design
Causal Research Design:
Core Objectives: Formulated to explain causality among critical market factors, establish cause-and-effect relationships between 2+ variables, and assist managers in making "If–then" statements about variables.
Methodological Focus: Collection of either secondary or primary data. Uses quantitative methods, emphasizing experimental setups (surveys, laboratory, field experiments) to isolate cause-and-effect mechanisms (structured data format and interpretation).
Example: Brand performance: Does brand credibility increase customers’ willingness to repurchase a brand?
Definition & Role of Research Design
Combining Research Designs
Combining Research Designs: Marketing research projects frequently combine multiple designs in a sequential process.
Researchers often begin with exploratory research to gain initial insights and build testable hypotheses, and then follow up with descriptive or causal research to test those hypotheses on large, representative samples.
Selecting the data collection method
Sources of data: Primary vs. secondary data
Primary data represent firsthand raw data and data structures. They are collected and assembled specifically for a current research problem.
Secondary data represent data not gathered for the immediate study at hand but for some other purpose.
Internal Secondary Data: Data collected by the individual company for accounting purposes, marketing activity reports, and customer knowledge.
External Secondary Data: Data supplied by outside entities
Selecting the data collection method
Secondary data: internal and external
Internal Secondary Data: Data collected by the individual company for accounting purposes, marketing activity reports, and customer knowledge.
Sales invoices (e.g., customer names, addresses etc.)
Accounts receivable reports (e.g., products purchased, total units, amount of sales, credit rating etc.)
Sales reports and sales activity reports (e.g., total units and amount of sale by: customer, salesperson, product, region etc.)
Warranty cards (e.g., reasons for product returns)
Credit applications (e.g., credit usage, credit ratings)
External Secondary Data: Data supplied by outside entities
Government documents (e.g., general statistics, external trade etc.)
Nongovernmental institutions (e.g., Direct Marketing Association)
Secondary business data (e.g., Datamonitor)
Statistical sources of secondary data (e.g., census)
Newspapers and commercial periodicals (e.g., Financial Times, Economist)
Functional roles of secondary data
Internal support data
Primary research support gain initial insights into a problem, refine research questions, and structure sampling plans
Presentation support provides empirical grounding and background facts (such as internal sales totals or operational metrics)
Decision-making support Informs tactical and strategic decisions using routine operational records (sales invoices, accounts receivable, sales activity reports) without incurring the cost or time required for new research
External market data
Trend analysis Tracks longitudinal shifts, macro-environmental developments, and demographic changes using official statistical sources, government documents, census data, and commercial periodicals
Business intelligence Generates continuous insights into broader industry health and economic conditions through secondary business databases (e.g., Datamonitor) and reports from nongovernmental institutions
Competitive intelligence Monitors competitor activities, trade data, and industry developments to identify emerging market threats and strategic opportunities
External customer data
Current and prospective customers Helps identify, profile, and segment both existing clients and potential target groups
Needs analysis Identifies customer pain points and product expectations
Customer knowledge Supports long-term customer management and KMS
What are the advantages and disadvantages of secondary research?
Advantages of secondary research
+ Less time-consuming
+ Low costs
+ Sometimes the only way to tackle a problem
+ Supports primary research
+ Enables initial insights into a research problem
Disadvantages of secondary research
— Accessibility
— Fit with current research problem
— Timeliness of data
— Structure of data
— Reliability and validity of results
— Comparability
— Exclusivity
Primary data
Qualitative vs. quantitative research
Primary data represents firsthand raw data and data structures collected and assembled specifically to address a current research problem; is gathered directly to fill specific information requirements.
Qualitative research used in exploratory designs to gain preliminary insights into decision problems and opportunities. (low generalizability)
Quantitative research places heavy emphasis on using formalized standard questions and predetermined response options in survey administered to large numbers of respondents. (high generalizability)
Characteristic | Qualitative Research | Quantitative Research |
|---|---|---|
Research Objectives | Discovery of new ideas; preliminary insights on and understanding of ideas and objects | Validation of facts, estimates, relationships, and predictions |
Research Design | Normally exploratory designs | Descriptive and causal designs |
Type of Questions | Open-ended, semi-structured, unstructured, deep probing | Mostly structured, formalized standard questions with predetermined response options |
Time of Execution | Short time frames | Significantly longer time frames |
Representativeness | Small samples, limited to the sampled respondents | Large samples, normally good representation of the target population |
Type of Analysis | Debriefing, subjective, content, interpretive, semiotic analyses | Statistical, descriptive, causal predictions and relationships |
Research skills | Interpersonal communications, observations, interpretive skills | Scientific, statistical procedure, and translation skills; some interpretation skills |
Guidelines for using qualitative & quantitative research methods
Guidelines for using qualitative research methods
Qualitative research methods are appropriate when decision makers or researchers are:
Identifying a problem, opportunity or establishing information requirements;
Obtaining preliminary insights into factors that affect marketplace behavior;
Building theories to explain relationships between two or more constructs;
Developing scale measurements for investigating market factors and behavioral outcomes;
Trying to determine preliminary effectiveness of marketing activities.
Guidelines for using quantitative research methods
Quantitative research methods are appropriate when decision makers or researchers are:
Validating or answering a problem, an opportunity situation, or information requirements;
Obtaining detailed descriptions or conclusive insights into factors that affect marketplace behavior;
Testing theories and models to explain relationships between two or more constructs;
Testing and assessing scale measurements for investigating market factors and behavioral outcomes;
Assessing the effectiveness of marketing activities;
Segmenting the market.
What are the advantages and disadvantages of qualitative & quantitative research methods?
Advantages of qualitative research methods
+ Economical and timely data collection
+ Richness of data
+ Accuracy of recording marketplace behaviors
+ Preliminary insights into building models and scale measurements
Disadvantages of qualitative research methods
— Lack of generalizability Inability to distinguish small differences
— Difficulty in establishing reliability and validity
— Difficulty in finding well-trained interviewers and observers
Advantages of qualitative research methods = disadvantages of quantitative research methods;
Disadvantages of qualitative research methods = advantages of quantitative research methods.
Qualitative & Quantitative research methods – An overview
Qualitative research methods
Direct approach
Focus group
In-depth interview
Indirect approach
Projective techniques
Observation techniques
Quantitative research methods
Survey method
Person-administered survey
Telephone-administered survey
Self-administered survey
Online survey
Experimental designs
Pre-experimental designs
True experimental designs
Quasi experimental designs
Qualitative research methods – Focus group method
Focus group research is a process of bringing a small group of people together for an interactive, spontaneous discussion on one particular topic or concept.
Uses of focus group research
provide data for defining and refining marketing problems
identify specific hidden information requirements
provide data for better understanding results from other quantitative studies
reveal consumers’ perceptions, attitudes, feelings, motives, hidden needs, and behaviors
generate new ideas about products and help explain changes in preferences
Conducting focus group research
Planning the study (recruitment and selection of participants, scheduling of the session)
Conducting the study (key role of the moderator, clear structure of the session)
Analysis and reporting (debriefing analysis with all key players, content analysis on raw data)
Qualitative research methods – In-depth interview
An in-depth interview is a process in which a well-trained interviewer asks a subject a set of predetermined and probing questions usually in a face-to-face setting.
Uses of in-depth interviews
To gain preliminary insights into what the subject thinks and feels and why he/she exhibits certain behaviors
To obtain unrestricted and detailed comments revealing opinions or beliefs
To have the respondent communicate as much detail as possible about issues of interest
Conducting in-depth interviews
Understand the problem and create appropriate research questions.
Decide on the best environment for the interview.
Select, screen, and contact prospective subjects.
Provide guidelines, create a comfort zone, and conduct the interview.
Analyze the narrative responses.
Write a summary report.
Types of in-depth interview method
Executive interview A personal exchange with a business executive usually conducted in his or her office.
Experience interview Informal gathering of information from individuals thought to be knowledgeable on issues relevant to the research problem.
Protocol interview The subject is placed in a specified decision-making situation and asked to verbally express the process and activities that he or she would undertake to make a decision.
Articulative interview A qualitative-oriented interviewing technique that focuses on the listening for and identifying of key conflicts in a person’s orientation values towards products, services, or concepts.
Qualitative research methods – Projective techniques
Projective techniques are indirect methods of questioning that enable a subject to project beliefs and feelings onto a third party, into a task situation, or onto an inanimate object.
Types of projective techniques
Word association test
Sentence completion test
Picture test
Cartoon or balloon test
Example: Sentence completion test
Please complete the following sentences
“People who own an iPhone are…….”
“People purchase an iPhone to …………”
Example: Picture test
Please write a short story about this advertisement:
Quantitative research methods – Survey method
Person-administered survey
Person-administered survey is a type of survey method that requires the presence of a trained human interviewer who asks questions and records the subject’s answers.
In-home/in-office survey Survey takes place in the respondent’s home, or within the respondent’s work environment.
Shopping-intercept survey Shopping patrons are stopped and asked for feedback during their visit to a shopping mall.
Purchase-intercept survey The respondent is stopped and asked for feedback at the point of purchase.
What are the advantages and disadvantages of person-administered surveys?
Advantages of person-administered surveys
+ Relatively high response rates, relatively few incomplete responses
+ More complex questions possible
+ Pictorial or mechanical aids can be involved (e.g., pictures, sorting cards)
+ Interviewer can control who is interviewed
+ Additional observations possible (e.g., clothing)
+ Adaptability and feedback possible
Disadvantages of person-administered surveys
— Time-consuming
— High expense
— Possible recording error
— Interviewer-respondent interaction error
Quantitative research methods – Survey method
Telephone-administered survey
Telephone-administered survey is a type of survey method that involves question-and-answer exchanges that are conducted via a telephone.
Traditional telephone survey Survey takes place over the telephone.
Computer-assisted telephone survey A computer is used to conduct a telephone survey; respondents give answers by pushing buttons on their phone.
Completely automated telephone survey The survey is completely administered by a computer; no human interviewer.
What are the advantages and disadvantages of telephone-administered survey?
Advantages of telephone-administered surveys
+ Can reach geographically dispersed samples
+ Repeated call-backs possible
+ Costs lower than for face-to-face
+ Higher response rates than self-administered surveys + Interviewers can be supervised
+ Anonymity reduces interviewer bias
Disadvantages of telephone-administered surveys
— No visual aids possible
— Less appropriate for complex questions/answer categories
— Less appropriate for sensitive questions
— Less appropriate for international research project
Quantitative research methods – Survey method
Self-administered survey
Self-administered survey is a type of survey method in which the respondent reads the questions and records his or her own answers without the presence of a trained interviewer.
Mail survey Questionnaires are distributed to and returned from respondents via the postal service.
Fax survey Surveys are distributed to and returned from respondents via fax.
What are the advantages and disadvantages of self-administered survey?
Advantages of self-administered surveys
+ Can reach geographically dispersed samples
+ Comparatively inexpensive
+ Respondent control (respondents decide when, where and how fast they answer the questions)
+ Superior for sensitive or embarrassing topics
+ No interviewer-respondent bias
+ Anonymity in response
Disadvantages of self-administered surveys
— No interviewer present to motivate respondents (lower response rates)
— No control who completed the questionnaire (potential response error)
— Use of visual aids hardly possible
— Additional observations are not possible
Quantitative research methods – Survey method
Online survey
Online survey is a type of survey method in which the respondent reads and answers the questions using online tools or platforms.
Email survey Surveys are distributed to and returned from respondents via email.
Internet survey The questionnaire is published on a website and respondents read and answer the questions online.
What are the advantages and disadvantages of online surveys?
Advantages of online surveys
+ Fast
+ Can reach geographically dispersed samples
+ Minimal staff required
+ Comparatively inexpensive
Disadvantages of online surveys
— No interviewer present to motivate respondents (lower response rates)
— No control who completed the questionnaire
— Additional observations are not possible
— Not everyone is online (Does sample represent target population?)
Factors to consider when selecting a type of survey method
Situational factors
Budget: Financial resources dictate whether high-cost modes (such as in-person interviews) or low-cost modes (such as online or mail surveys) are feasible
Completion Time Frame: Tight decision deadlines necessitate fast collection tools (e.g., online surveys) over slower, time-consuming methods
Quality Requirements: The necessary standards for data integrity and procedural rigor
Generalizability: The degree to which results can be extended to reliably represent the broader target population
Precision: The level of exactness needed in data measurement and statistical estimation
Task-related factors
Difficulty of Task: Complex tasks or intricate rating exercises often require a human interviewer to explain instructions, whereas simple tasks can be self-administered
Stimuli Needed to Elicit a Response: If visual aids, sorting cards, or product concepts must be displayed, personal or online surveys must be selected over audio-only telephone surveys
Completeness of Data: The presence of an interviewer helps ensure all questions are answered, minimizing missing data compared to unmonitored questionnaires
Research Topic Sensitivity: Embarrassing or delicate subjects yield higher accuracy when respondents answer anonymously using self-administered tools
Respondent-related factors
Diversity in Specified Characteristics: The degree of demographic, geographic, or socio-economic variation present across target subjects
Incidence Rate: The percentage of the general population that meets the qualification criteria for the study; low incidence rates favor broad, cost-effective screening modes like telephone or web surveys
Participation Rate: The overall willingness of potential respondents to complete the survey across different contact methods
How can respondents be encouraged to cooperate in surveys?
• Emphasize the value of research to motivate respondents
• Use incentives and emphasize that respondent’s opinion makes a difference
• Design short, dynamic surveys
• Communicate the confidential nature of the research and privacy policies
• Use multimode surveys
Multimode surveys are a survey strategy used to encourage respondent cooperation and increase participation rates by giving respondents multiple ways or channels to complete a study
Quantitative research methods – Experimental designs
Experimental research is primarily a hypothesis testing (deductive) method.
deductive research: investigations are undertaken to test hypothesized relationships between variables derived from the use of existing theories.
Experimental studies look for cause and effect (i.e., causal research). They start with a hypothesis based on logic or previous theory that a change in x causes a change in y.
Experimental research is used to infer causal relationships.
Evidence is required to show causality.
Causality applies when the occurrence of x increases the probability of the occurrence of y.

Three Conditions to Establish Causality
Concomitant variation: X and Y must occur or vary together.
relates to the causal relationship between variables.Time order of occurrence of variables: The change in X must occur prior to the change in Y.
refers to the direction of causality (i.e., which is the independent and which is the dependent variable)Absence of competing explanations: No alternative variable can explain the change in Y.
refers to the validity of the causal relationship (i.e., x is the only possible causal explanation for y)
Types of Variables used in experimental designs
Independent variable (predictor, treatment variable, X): is an attribute or element of an object, idea, or event whose values are directly manipulated by the researcher. It is assumed to be the causal factor of a functional relationship with a dependent variable
Dependent variable (criterion, Y): is an observable attribute or element that is the outcome on specified test subjects that is derived from manipulating the independent variable(s).
Control variable: Variable controlled by the researcher so it does not interfere with functional relationship between independent and dependent variable X → Y.
Extraneous variable: Uncontrollable variable that should average out over a series of experiments, however can cause confounding impact on Y if unaccounted for that could weaken or inflate and thus invalidate the results of an experiment

Quantitative research methods – Experimental designs
Laboratory and Field experiment (Experiment Settings)
Laboratory Experiment: Causal research design that is conducted in an artificial setting
+ High internal validity, .controllable situation, secrecy, lower expenses.
– Low external validity, contamination due to demand characteristics.
Field Experiment: Causal research design that is conducted in a natural real-life setting.
+ High external validity, lower contamination due to demand characteristics.
– Less controllable situation, high expenses, time consuming.
Quantitative research methods – Experimental designs
Experimental Validity
Internal Validity: Ability to show unambiguous cause-and-effect relationships (X → Y): Manipulation of the independent variable actually caused the effect in the dependent variable.
Example: Different ads were shown to 2 comparable groups vs. ads were on air in regions that may differ with regard to income, weather, culture …
Potential problems: Competing explanations?
External Validity: Applicability and generalizability of experimental findings to real-world situations.
Example:
(1) sales vs. purchase intentions,
(2) subjects go shopping vs. subjects know that you ask them to evaluate your product
Potential problems: Purchase intention may not represent purchases, no „real-life“ behavior …
Types of experimental designs
Pre-experimental designs:
– One-shot case study (EG: X O1)
– One-group pretest-posttest (EG: O1 X O2)
– Static group comparison (EG: X O1 | CG: O2)
True experimental designs:
– Posttest-only control group (EG: (R) X O1 | CG: (R) O2)
– Pretest-posttest control group (EG: (R) O1 X O2 | CG: (R) O3 O4)
– Solomon four group (EG1: (R) O1 X O2 | CG1: (R) O3 O4 | EG2: (R) X O5 | CG2: (R) O6)
Quasi-experimental designs
– Time series, Multiple time series
Statistical designs
– Randomized blocks, Latin square, Factorial design
Symbols Notation
X = Exposure/Treatment
O = Observation/Measurement
R = Random assignment
EG = Experimental group
CG = Control group
Notes
A horizontal left-to-right movement refers to a movement through time.
The vertical alignment of symbols implies they refer to activities that occur simultaneously at a point of time.
The horizontal alignment of symbols implies all those symbols refer to a specific treatment group of test subjects
One-shot Case Study (After-only design)
EG: X O1
A single group of test subjects is exposed to the independent variable treatment (X), and a single measurement of the dependent variable (O1) is taken.
Treatment Effect: O1 – O0
O0 = Hypothetical value derived from past experience or common knowledge
O1 = Observed value for the dependent variable
Discussion:
Extraneous variables are not controlled;
no control group and no group comparisons.
Example: Contact with an ad → attitudes toward brand.
One-group pretest-posttest design
EG: O1 X O2
First a pre-treatment measure of the dependent variable is taken O1, then the test units are exposed to the independent variable (X), and then a post-treatment measure of the dependent variable is taken O2.
Treatment effect: O2 – O1
O1 = Pre-treatment measure of the dependent variable
O2 = Post-treatment measure of the dependent variable
Discussion:
• Extraneous variables are not controlled
• No control group and no group comparisons
Example: Attitudes toward brand – contact with ad – attitudes toward brand
Static group design
EG: X O1
CG: O2
There are two groups of test units. The experimental group is exposed to the independent variable, and the control group is not exposed to the independent variable. The dependent variable is measured in both groups after the independent variable treatment.
Treatment effect: O1 – O2
O1 = Post-treatment measure of the dependent variable in the experimental group
O2 = Post-treatment measure of the dependent variable in the control group
Discussion:
• Extraneous variables are not controlled
• Selection bias might be present
• Assumption that the two groups are similar in terms of pre-treatment measures of the dependent variable
• No assessment of changes in individual test groups
Example: Analysis of sales for a product in shops with sales promotion activities and shops without sales promotion activities
Posttest-only control group design
EG: (R) X O1
CG: (R) O2
There are two groups of test units. Test units are randomly assigned to one of the two groups. The experimental group is exposed to the independent variable, and the control group is not exposed to the independent variable. The dependent variable is measured in both groups after the independent variable treatment.
Treatment effect: O1 – O2
O1 = Post-treatment measure of the dependent variable in the experimental group
O2 = Post-treatment measure of the dependent variable in the control group
Discussion:
• Extraneous variables are not controlled
• Selection bias might be present, but decreased through random assignment (R)
• Assumption that the two groups are similar in terms of pre-treatment measures of the dependent variable
• No assessment of changes in individual test groups
Example: Analysis of sales for a product in shops with sales promotion activities and shops without sales promotion activities. Shops have been randomly assigned to the groups.
Pretest-posttest control group design
EG: (R) O1 X O2
CG: (R) O3 O4
There are two groups of test units. Test units are randomly assigned to one of the two groups. Both groups receive a pre-treatment measure of the dependent variable. Then, the experimental group is exposed to the independent variable, and the control group is not exposed to the independent variable. The dependent variable is measured in both groups after the independent variable treatment.
Treatment effect: (O2 – O1) – (O4 – O3)
O1 = Pre-treatment measure of the dependent variable in the experimental group
O2 = Post-treatment measure of the dependent variable in the experimental group
O3 = Pre-treatment measure of the dependent variable in the control group
O4 = Post-treatment measure of the dependent variable in the control group
Discussion: Only pretest effects might introduce biases.
Example: Assessment of brand image prior to and after an advertising campaign was presented to an experimental and a control group. Only the experimental group was exposed to the new campaign.
Solomon four group test
EG1: (R) O1 X O2
CG1: (R) O3 O4
EG2: (R) X O5
CG2: (R) O6
This design combines the pretest-posttest control group and posttest-only control group designs and provides direct and reactive effects of testing.
Treatment effect (O5– O6)
Pretest effect [O2– O1] – [O5- 0,5*(O1 + O3)]
Discussion
Elimination of all extraneous variables effects and pretest effects
Complex design, lengthy time requirements
Example Assessment and comparison of sales for a product prior to and after sales promotion activities in one group of shops and another group of shops without sales promotion as well as two further groups of shops of which only one conducts sales promotion activities. Here, sales are measured after the promotion activity took place.
Qualitative and quantitative observation techniques
What is an observation method?
The systematic activities of witnessing and recording the behavioral patterns of objects, people and events without directly communicating with them.
Observations may involve watching people or watching phenomena.
Observation situations
People watching people
People watching phenomena
Machines watching people
Machines watching phenomena
Conditions for the use of observation
Information Current behavioral patterns must be part of the data requirements.
Type of data Necessary data must be observable.
Time frame Data patterns must be repetitive, frequent and predictable in a pre-specified time frame.
Setting Behavior is usually observable in some public or laboratory setting.
Devices for electronic/mechanical observation
People Meter, Tracking software, Scanner-based panel, Voice pitch analyzer, Pupilometer, Eye tracking monitor, Psychogalvanometer
Unique characteristics of observation techniques
Directness of observation
Direct observation – observing actual behaviors or events and recording them as they occur
Indirect observation – observing the recorded artefacts of past behaviors; sometimes called trace analysis
Subject’s awareness of being observed
Disguised observation – subjects of interest are unaware that they are being observed
Undisguised observation – subjects of interest are aware that they are being watched
Structuredness of observation
Structured observation – the researcher specifies beforehand what events are to be observed
Unstructured observation – the observer is not restricted by what should be recorded, and ideally should monitor all events of the phenomenon that seem relevant to the problem of interest
Type of observing mechanism
Human observation – the researcher or trained observer records texts, actions or behaviors as they occur
Electronic/mechanical observation – observing with an assistance of a mechanical or electronic device
Example: Mystery shopping
The mystery shopper poses as a consumer and shops at a company’s own stores or those of its competitors to collect data about customer-employee interactions and to gather observational data. He or she may also compare prices, displays, and the like.
How would you describe the observation technique mystery shopping using the aforementioned characteristics?
What are the advantages and disadvantages of observations?
Advantages of observations
+ Accuracy of actual behavior
+ Reduction of confounding factors
+ Detail of the behavioral data
+ Elimination/reduction of bias
+ The only choice of some data types
+ Nature of phenomenon
Disadvantages of observations
— Lack of generalizability of data
— Inability of explaining behaviors or events
— Complexity of setting and recording of behaviors or events
— Selective perception
— Can be time-consuming and expensive
— Impossible for some data types
— Ethical problem
Designing the measurement instrument
Types of data collected in research practices
State-of-being data (verifiable facts)
The physical, demographic, or socioeconomic characteristics of people, organizations, or objects.
State-of-mind data (cognitions and affects)
The mental thoughts and emotional feelings of people.
State-of-behavior data (past and current behavior)
A person’s or organization’s current observable or recorded past actions.
State-of-intention data (planned future behavior)
A person’s or organization’s expressed plans of future actions.
What is measurement?
Measurement refers to an integrated process of assigning numbers or labels to determine the amount or intensity of information about a particular object.
Objective properties of objects (concrete, tangible attributes, directly observable and measurable)
Subjective properties of objects (abstract, intangible attributes, not directly observable and measurable)
Examples of concrete and abstract properties of objects
Object = individual
Concrete properties: Gender, age, marital status, income, brand last purchase, …
Abstract properties: Attitudes towards a product, emotions, intelligence, brand loyalty, …
Object = organization
Concrete properties: Name, total assets, number of employees, number of customers, type of industry, …
Abstract properties: Competence of employees, channel power, competitive advantage, company image, …

Conceptualization and operationalization of constructs
Constructs are hypothetical variables made up of sets of component responses or behaviors that are thought to be related.
Constructs need to be conceptualized and operationalized
Conceptualization refers to the determination of a construct’s dimensionality.
Operationalization means explaining a construct’s meaning in measurement terms by specifying the activities or operations necessary to measure it.

Scale measurement
Scale measurement refers to the process of assigning descriptors to represent the range of possible responses to a question about a particular object or construct.
Relevant issues to consider
Levels of scales
Scale format
Number of items
Quality of measures
Properties of scale measurement
Assignment Allows the researcher to identify an object in a set by means of unique descriptors.
Order Allows the researcher and respondent to create hierarchical rank-order relationships among objects.
Distance Allows the researcher and respondent to identify, understand, and accurately express absolute differences between objects.
Origin A unique scale descriptor that represents the true natural zero or true state of nothing.
Scale measurement – Levels of scales
Nominal Scale
Characteristics are assigned to categories/numbers – rules defined by the researcher
Numbers are labels only
Only possible arithmetic operation: count of each category (mode, percentages)
Example: Colors: green = 1, red = 2, blue = 3
Gender: female = 1, male = 2
Nationality: Australian = 1, Chinese = 2, Italian = 3, German = 4
Ordinal Scale
Objects are ranked
Differences between scale values are not known
Scale values represent ranks, not a certain “amount” of an attribute (e.g., liking, size)
Since differences between scale values are not known arithmetic operations are limited (median, mode)
Example: How do you like the following airlines? Please rank them. (1 = most preferred, 3 = least preferred)
Interval Scale
Objects can not only be ranked but scale values do also show the amount of difference between objects
Interval scales provide metric data
Metric data provide more information than nominal or ordinal data
Metric data can always be transformed to ordinal data
Many statistical methods require metric data (e.g., mean value, regression analysis etc.)
Example: Day 1: 24°C, Day 3: 15°C. On day 1 it was 9°C warmer than on day 3.
Rating scales (often used in market research) are usually interpreted as interval scales.
Note: Differences between scale categories are assumed to be equal
Example: To what extent do you agree with the following statements regarding the brand „Porsche“? 1 - Strongly disagree, 5 - Strongly agree
Ratio Scale
Special kind of interval scale with a fixed/natural zero point
Ratio scales provide metric data
Ratio scales can be transformed in lower level scales
Ratio scales allow application of all statistical techniques
Example: Sales figures, weight, age, citizens of a town
Examples of the types of question phrasings
Nominal question phrasing When you are in the mood for a coffee break, do you usually enjoy a coffee at the cafeteria?
Ordinal question phrasing When you are in the mood for a coffee break, how often do you enjoy the coffee from the cafeteria?
□ Never □Seldom □Occasionally □ Usually □Every time
Interval question phrasing Thinking about the quality of your last coffee at the cafeteria, please circle the number that best expresses the level of quality.
1=Very bad 2=Bad 3=Neutral 4=Good 5=Very good
Ratio question phrasing
Thinking about your coffee consumption over the last three days, how many cups of coffee did you enjoy?___ cups
Scale formats
Comparative rating scales A scale format requiring a judgment comparing one object against another.
Noncomparative rating scales A scale format requiring a judgment without reference to another object.

Comparative rating scale
Paired-comparison rating scale
It requires respondents to make a judgment by directly comparing one object against another.
Respondents are presented with two objects at a time (a pair) and asked to select which of the two they prefer or rate higher based on a specific criterion

Comparative rating scale
Rank-order rating scale
It requires respondents to evaluate multiple objects simultaneously by ordering them according to a specific criterion (e.g., preference, importance, or liking)
Respondents are presented with a list of items and instructed to assign sequential rank numbers
Numbers represent hierarchical ranks rather than precise amounts of an attribute, meaning the exact differences or distances between scale values remain unknown

Comparative rating scale
Constant sum rating scale
It requires respondents to divide a fixed total sum of units (e.g., 100 points or percentages) among a set of objects, features, or attributes to reflect their relative preference or importance
forces respondents to evaluate items directly against one another under a fixed budget or point limit
Respondents are given a predetermined total sum to allocate (commonly 100 points) and instructed to assign points across multiple features according to a specific criterion

Noncomparative rating scale
Likert Scale
Evaluates degrees of agreement or disagreement with structured statements
Respondents are presented with a series of statements regarding a specific construct, product, or brand and are instructed to indicate their level of agreement or disagreement along a numerical continuum (commonly a 5-point scale ranging from 1 = Completely/Strongly disagree to 5 = Completely/Strongly agree)

Noncomparative rating scale
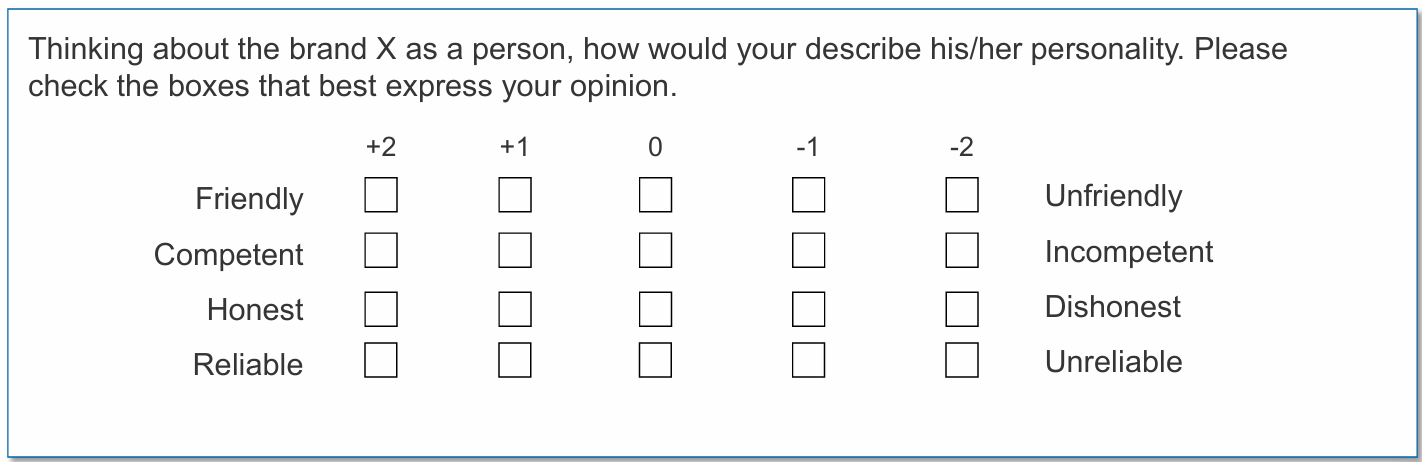
Semantic differential
it requires respondents to evaluate an object independently without comparing it directly to another object
It measures attitudes, brand image, or personality perceptions by presenting respondents with a continuum anchored at opposite ends by bipolar adjective pairs (or antonymous descriptors)
Respondents choose the point along the scale that best reflects their opinion
Evaluates attitudes or personality perceptions along a continuum anchored by bipolar adjective pairs
Noncomparative rating scale
Other forms of noncomparative rating scales
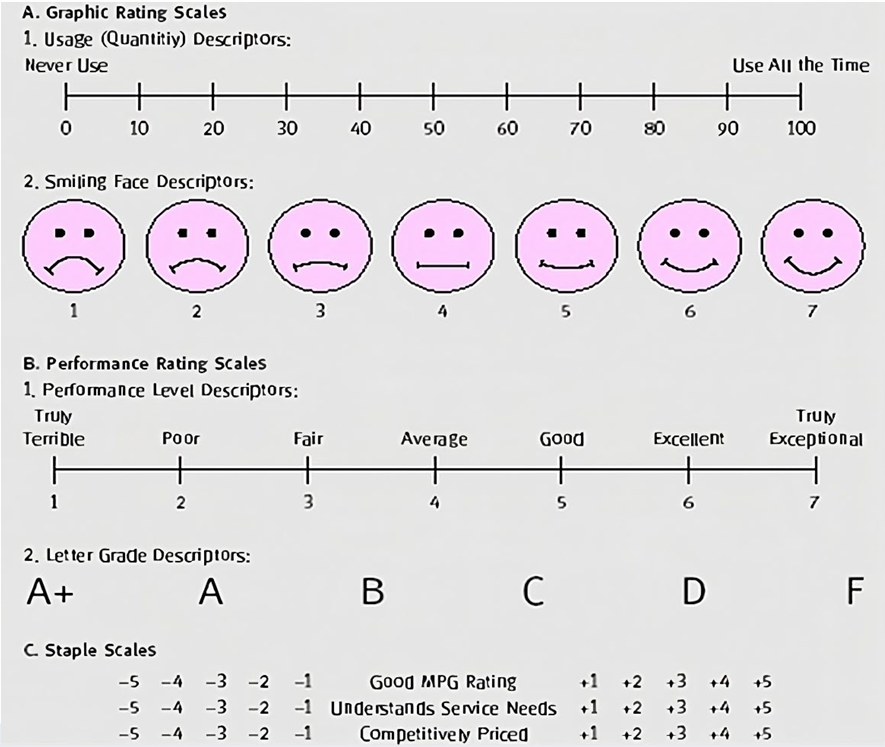
Graphic rating scales use visual representations or continuous lines to help respondents indicate their evaluation
Usage (Quantity) Descriptors: A continuous numerical line (e.g., ranging from 0 to 100) anchored by extreme endpoints such as "Never Use" at 0 and "Use All the Time" at 100
Smiling Face Descriptors: A visual scale using a series of facial expressions (typically 1 to 7 face illustrations ranging from a frown to a smile). This format is especially useful for children, non-native speakers, or quick customer feedback terminals
Performance Level Descriptors: A 7-point scale anchored by specific verbal descriptors: Truly Terrible (1), Poor (2), Fair (3), Average (4), Good (5), Excellent (6), and Truly Exceptional (7)
Letter Grade Descriptors: Scales that use familiar academic grading symbols (A+, A, B, C, D, F) to rate objects or attributes
Stapel Scales A unipolar rating scale designed to measure the intensity and direction of an attitude toward a single central adjective or concept
It typically consists of a vertical or horizontal numerical range (e.g., -5 to +5) without a neutral zero point, centered around a single target descriptor
Number of items
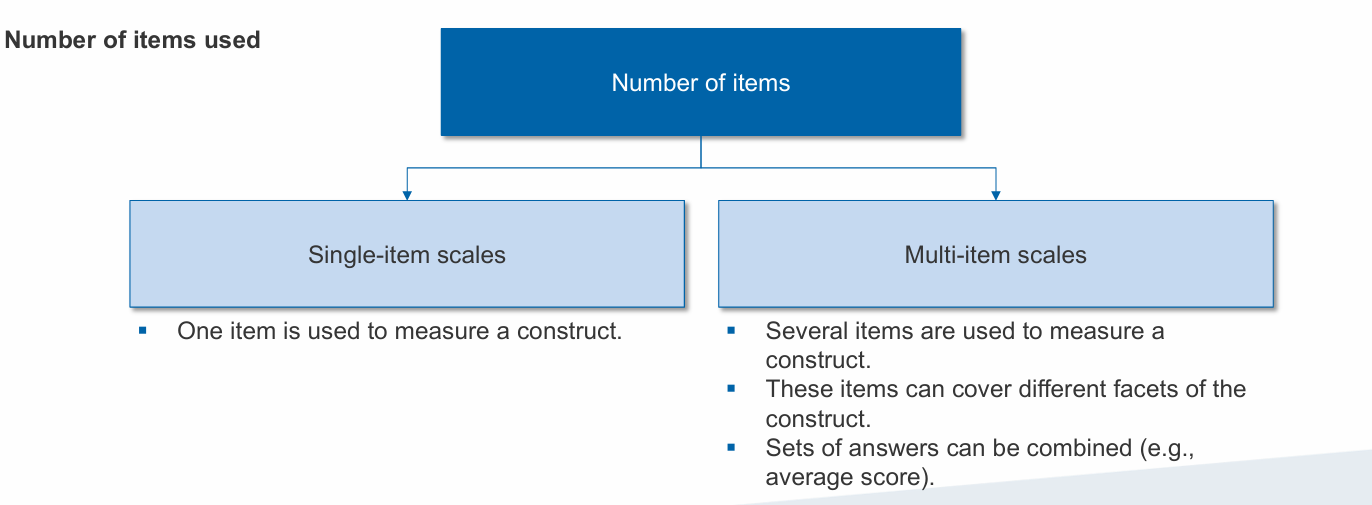
Single-item scale
Itemized-category scale
One item with answer categories
Item has to represent the whole construct
Multi-item scale
More than one item with answer categories
Items have to represent the whole construct
When should I use single-item versus multi-item scales? Factor that influences this decision: nature of the attributes of interest
Concrete attributes (e.g., gender, age, marital status, income, brand, last purchase)
Abstract attributes (e.g., attitudes towards a product, emotions, intelligence, brand loyalty)
Example: Customers’ assessment of service quality of after-sales services as provided by company X
Attribute: perceived service quality
Scale evaluation – Criteria for good measurements
Validity refers to the extent to which a scale truly measures what it is supposed to measure.
Content (face) validity: The extent to which measures of a construct represent that construct
Convergent validity: The extent to which measures of a construct are highly correlated with known existing measures of the same construct (assessed via item-to-total correlation)
Discriminant validity: The extent to which measures of a construct are not highly correlated with measures of clearly different constructs (assessed via the Fornell/Larcker criterion)
Nomological validity: The extent to which a construct fits theoretically within a network of other established constructs that are related yet different (assessed through supported hypotheses)
Reliability refers to the degree to which a scale can reproduce the same measurement results in repeated trials. (Measures should be consistent in repeated measures and must not be at random.)
Assessment of stability over time through the test-retest approach: A technique of measuring scale reliability by administering the same scale to the same respondents at two different times or two different samples of respondents under similar conditions.
Equivalent form approach: A technique of measuring scale reliability by measuring and correlating the measures of two equivalent scaling instruments.
Assessment of internal consistency using coefficient alpha: The degree to which the various dimensions of a multidimensional construct correlate with the scale.
Relationship between reliability and validity
If a scale measurement is unreliable, it cannot be valid. However, if a scale measurement is reliable, it is not necessarily valid.
Example: We want to measure customer satisfaction with a product.
We use the following scale measurement to capture customer satisfaction: How old are you?
We retest the scale measurement two weeks later using the same scale measurement: How old are you?
A comparison of both values reveals few differences between the two values (i.e., high reliability).
How would you evaluate validity of the scale “How old are you?“ to capture customer satisfaction?
Scale measurement – Quality of measures
Types of errors in empirical research that influence the quality of measures
Errors caused by interviewers
Lack of interviewing skills
Respondent’s impression of interviewer
Questioning, probing for details, recording
Cheating, …
Errors caused by the measurement instrument
Consistency motif (hypotheses guessing)
“Yes-saying” (tendency to agree with statement)
Mono-method bias
Demand characteristics (social desirability bias)
Order bias, …
Errors caused by the respondent
Non-response (evaluation apprehension)
False-response, …
Questionnaire design
Step 4: Development of questions/scales
Two relevant aspects: questions and answers
Issues to consider regarding questions
Question wording: The primary task is to evaluate the wording of the questions
Rules:
Define clearly the issues being addressed.
Use ordinary, unambiguous words, positive and negative statements
Avoid leading questions, implicit alternatives, implicit assumptions, generalizations and estimates.
Question format Development of questions/scales
Closed questions
Dichotomous questions
Multiple-choice questions
Questions in scale measurement formats
Open-ended questions Thinking about the brand “Colgate”, what comes to your mind?
Issues to consider regard answers
Design of answers/scaling
Consider number of scale categories: few vs. many
Consider labeling of scale categories: uneven vs. even
Consider balance of scale categories: labeling of scale endpoints vs. all scale categories / balanced vs. unbalanced scale
Allowing respondents to indicate lack of knowledge/experience: I don’t know product X.

Key criteria in designing measurement instruments
Intelligibility of the questions
Reliability of the scale
Appropriateness of scale descriptors
Discriminatory power of the scale descriptors
Balancing positive/negative scale descriptors
Inclusion of a neutral response choice
Measures of central tendency and dispersion
What is a target population?
What is sampling?
What is a sample? Why do we sample?
What is a census?
A target population is the defined set of elements identified for investigation based on the evaluation of the research objectives, feasibility, and cost-effectiveness.
Sampling is the selection of a small number of elements from a larger defined target population and expecting that the information gathered from the small group will allow accurate judgments to be made about the target population.
A sample is a selection of elements from the target population.
A research study that collects data from every member of the target population is called census.
Main reasons for sampling
Limited resources
Scarcity
Destructive testing
May be more accurate
Sampling process