Geography Unit 4: Topic 2 Global Population Change
 Call Kai
 Learn
Learn Practice Test
 Spaced Repetition
 Match
Match Flashcards
 Knowt Play
1/49

There's no tags or description
Looks like no tags are added yet.
Name | Mastery | Learn | Test | Matching | Spaced | Call with Kai | Chat |
|---|
No analytics yet
Send a link to your students to track their progress
50 Terms
Population Momentum
Explains why a population can continue to grow even if replacement declines to below 2.1 as there is still a large portion of women who are in the child-bearing years (I5-49).
It can be negative or positive, but if the population decreases, it will continue to decrease.
Constrictive Population Pyramid
Declning population indicating below-replacement birth rates and an aging population, fewer children, more elderly, natural decrease/ negative population momentum without immigration.
Characteristic of Stage 5 of DTM
Stationary Population Pyramid
Stable population with balanced death and birth rates and reoughly equal youth and elderly populations.
Characteristic of Stage 4 of the DTM
Expansive Population Pyramid
Growing population, youthful population, high birth and death rates
Seen in developing, low-income countries with lack of access to contraception and medical services and cultural norms and agricultural lifestyles promoting child-bearing
Characteristic of Stage 2 of DTM
Dependency Ratio
Measures the pressure on a productive workforce comparing the number of dependents (under 15 and 65+) to working age adults (15-64)
Higher ratio means more strain on workforce for services (e.g. pensions, health care)
Lower ratio means a more robust economy (more tax)
Fertility Rate
The average number of children per woman of child-bearing age (usually 15-49) in her lifetime.
If the rate falls below 2.1 (total replacement fertility rate) it will lead to population decline. This rate factors in extra male births and infant mortality.
Rate of Natural Increase (RNI)
The birth rate minus the death rate expressed as a percentage
More births than death leads to a population increase and vice versa, however it does not take into account emigration and immigration
A positive RNI indicates Stage 2 of the DTM
A negative RNI indicates Stage 5 of the DTM
Net Migration Rate
The number of immigrants minus the number of emigrants per 1000 people.
NMR = i-e/ mid-year population x 1000
Age/ Sex Structure
The composition of a population by age (e.g. 0-4 years, 5-9 years etc.) and sex (male, female), often represented by a population pyramid.
Life Expectancy
The average number of years a newborn infant is expected to live, given the mortality rate at their time of birth.
Infant Mortality Rate
Ratio of children under the age of 1 that die in their first year compared to the total number of live births that year, expresed as a rate of 1000 live births.
IMR = deaths among children <1 year/ number of live births x 1000
Death Rate
Annual number of deaths per 1000 people.
Deaths/ 1000 = deaths per year/ total population x 1000
Birth Rate
Annual number of live births per 1000 people.
Births/ 1000 = births per year/ total population x 1000
GNI per capita ($US PPP)
Stands for the “Gross National Income in Purchasing Power Parity” measuring a country’s relative wealth in current international dollars
Amenity
Refers to the desirable features or facilities of a place including shops, employment, health care, transport, culture, leisure activities, and green spaces.
Environmental amenity includes quality of environmental goods such as clean air and water.
Remittances
Sending money home to families but also supports the country their family is in
Forced Migration
People forced to move internally are an Internally Displaced Person (IDP), people forced to migrate internationally are a refugee and a refugee without documented status of ‘refugee’ are an asylum seeker.
Drivers include push factors such as violent conflict and military intervention, structural exclusion based on attributes such as race, religion, or gender, an elitist economy leading to economic exploitation, poverty, and unsustainable development leading to flooding, desertification, limited services and opportunites.
Voluntary Migration
A person who chooses to resettle in a new region due to pull factors such as education, family reunification, lifestyle, governance, or economic opportunities
Impacts of migration on places of origin
Reduction in taxable income leading to less services (e.g. health care, education)
Loss of familial ties
Less competition for resources
Remittances (in cases of ecomonic migrants)
Declining populations and gender imbalance
Decline in agricultural production as the workforce declines
Impacts of migration on places of destination
Community hostilities (discrimination, racism)
Ghettoism (extreme forms of residential concentration by culture, religious belief or ethnicity accounting for most of the area’s population)
Increased government revenue due to more taxable income leading to more services
Manages demographic change for example bringing more youth to balance an elderly population
Increased competition for resources and services leading to pressure on housing and other infrastructure (e.g. longer wait times for medical services, increased traffic and transit blockages)
More innovation due to an increased number of skilled workers (e.g. technology)
Overcrowding and poverty (note this is dependent on the rate of migration)
Migration Rate
Immigration number minus emigration number per 100 people
Pull factor
Something that draws someone to an area
Push factor
Something that causes someone to move away from an area
Zelinsky’s Model Stage 1
Pre-modern Society
Aligns with the first stage of the Demographic Transition
Natural increase is low and limited mobility to nomadic movements in rural areas
No option to migrate
Zelinsky’s Model Stage 2
Early Traditional Society
Rising population and dramatic increase in rural to urban migration as a result of rapid industrialisation and urbanisation
Migration flows to settlement frontiers and overseas also occur
Displacement towards regions with economic opportunities
Zelinsky’s Model Stage 3
Late Traditional Society
New areas developed
Slackening rate of frontierand overseas migration
Rural populations begin to fall and rural to urban migration is replaced by inter-urban and intra-urban migratio
Zelinsky’s Model Stage 4
Advanced Society
Rate of natural increase flattens
Decrease in rural-urban migration.
Increase in interurban and intraurban migration as urban centres merge
Counter-urbanisation begins to emerge in response to urban diseconomies and lifestyle-based movements
Zelinsky’s Model Stage 5
Super-Advanced Society
Significant levels of interurban and intraurban migration and temporary short-term migratory movements for education, employment, and quality of life.(circular mobility)
Mobility influenced by environmental and technological factors.
Zelinsky’s Model
Describes migratory processes in industrialised countries over time showing how mobility evolves with socio-economic development

Demographic Transition Model (DTM)
Describes how changes in population growth respond to relative differences in birth and death rates, which themselves change over time
Stage 1 of DTM
high birth and death rate
Natural increase is close to zero
Tent-shaped
E.g. Isolated tribes in the Amazon

Stage 2 of DTM
Early expanding stage where population begins to rise
High birth rate and rapidly falling death rate
Rapid increase in natural increase
Pyramid-shaped
Afghanistan, Haiti, sub-Saharan Africa

Stage 3 of DTM
Late expanding stage
Birth rate decreases whilst whilst the death rate remains low
Population continues to increase but not as quickly as Stage 2 as low births and deaths are at an equilibrium
Natural increase is still positive
Door-shaped (think more opportunities)
Mexico, Philippines, Indonesia, Malaysia

Stage 4 of DTM
Low stationary phase
Low birth rates, while death rates start to increase
Natural increase is close to zero
Bubble-shaped
E.g. United States, UK, France, Argentina, Australia

Stage 5 of DTM
Birth rates remain low whilst the death rate increases
Countries with a negative NIR decrease in population due to fewer men and women in child-bearing years
Tear-drop shaped
Germany, Italy, Japan, Russia, South Korea

Reasons for high death rate
High levels of disease
Lack of health care
Lifestyle diseases
Less youth to work in health care
Lack of education
Competition for food
War
Reasons for high birth rates
Lack of family planning or contraception
high infant mortality rate putting babies in the ‘bank’
Religious or cultural beliefs
Workers needed in agriculture
Reasons for decreasing death rates
Improved health care, hygiene and sanitisation
Improved food production and storage
Decreased Infant Mortality Rates
Reasons for decreasing birth rates
Family planning and birth control available
Increased living standards and resources
Changing status of women (more in the workforce, marrying later, education)
Fewer women having children
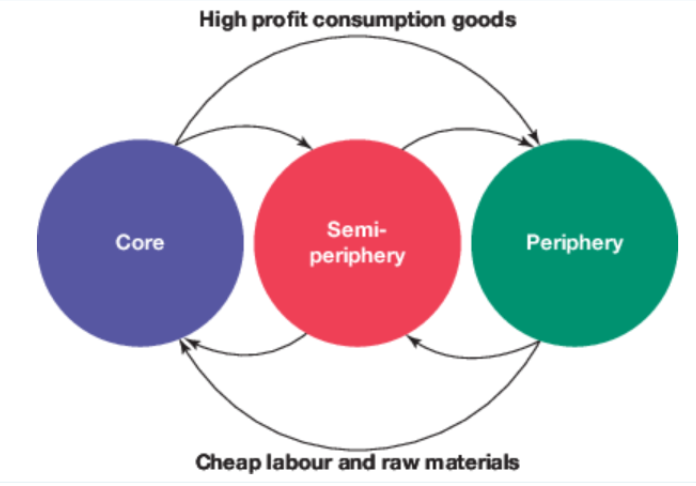
Wallerstein’s World Systems Theory
Explains the evolution of feudalism to modern day capitalist countries and trade, focusing on the flow of resources between core nations (high-income), semi-periphery (moderate income, manufactured goods), and periphery nations (low income, cheap labour, and raw materials.
Core nations exploit periphery and semi-periphery nations to maintain wealth using economic and political power to force a colonial relationship.
Core Nations
Describes the advanced economic core of a country of region surrounded by the less economically developed periphery
E.g. the United States which exports capital intensive products to the semi-peripheral and peripheral regions
Semi-Periphery Nations
Second-tier industrialised countries
E.g. Brazil which is not as advanced as those of the core
Periphery Nations
Agricultural countries
E.g. countries in Africa which export labour and commodities to the core and semi-periphery nations
Rostow’s Model
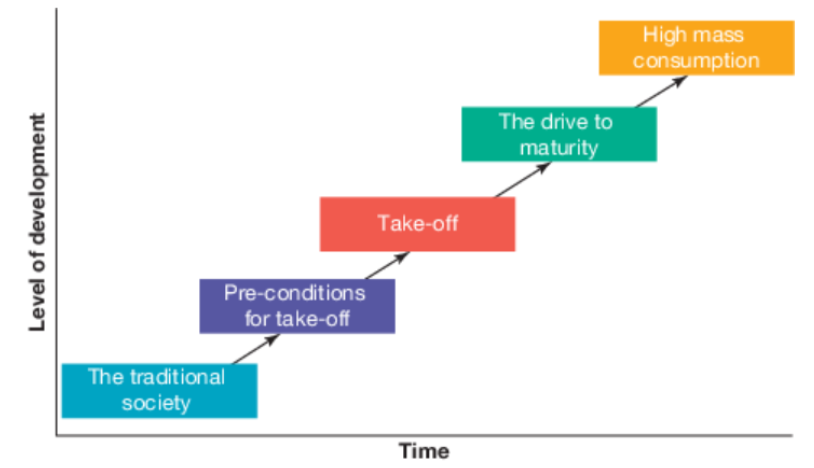
Explains how after initial capital investment countries embark on an evolutionary process (approx. 60 years)
Stage 1 of Rostow’s Model
Traditional Society
Labour intensive agrarian economy, relatively static population with limited technology
Stage 2 of Rostow’s Model
Pre-Conditions for Take-Off
Western development aid and investment assist improvements in agriculture and economic infrastructure and encourage further overseas investment
Improvements in life expectancy and declining death rates
Stage 3 of Rostow’s Model
Take-Off
Short industrialisation period of rapid economic growth
New urbanised entrepreneurial and middle class
High demographic growth and rural-urban migration
Stage 4 of Rostow’s Model
Drive to Maturity
Long period of increasing standards of living
A diversifying economy leads to social changes such as later marriage slowing population growth
Stage 5 of Rostow’s Model
High Mass Consumption
Highly urbanised consumer economy
Limitations of Rostow’s Model
Driven by investment/ development not social factors such as local governance, social inequality and wealth distribution
Linear bias, assuming a rigid path/ trajectory with no option to bypass stages