Information Systems
 Call Kai
 Learn
 Practice Test
 Spaced Repetition
 Match
 Flashcards
 Knowt Play
1/55

There's no tags or description
Looks like no tags are added yet.
56 Terms
what do formulas do
calculate results from the values in other cells
what happens when you copy a formula, what is this called
the cell references shift by the same distance you moved it (relative reference)
how to lock an absolute reference
put a dollar sign before and in middle of cell “name”
mixed reference for column
$A1
mixed reference for rows
A$1
ranges
a group of cells, written as two corner cells joined by a colon
What do formats do
change how a value looks when you use them, to present numbers clearly.
=SUM()
totals numbers in a range
=IF(condition, value if true, value if false)
checks condition and then gives one result If it is true and a different result if it is false.
when to use IF
use when calculation depends on something ex) vat charged only if price is over 200
OR and AND
to test several conditions at once and return TRUE of FALSE
OR = (condition 1, condition 2); true if at lease one condition is true is false only when all are false
AND = (condition 1, condition 2) is true only if all conditions are true. It is false as soon as one is false
ROUND
rounds a number to a set number of decimal places and actually changes the stored value (#, decimal)
JOIN and CONCATENATE
join values together as text, one after another, used to build full names from a table of cells
VLOOKUP
searches for a value in the first column of a table and then returns the value from another column in the same row
to look up something from a code or name
COUNTIF
counts the cell in a range that meet one condition
=countif(range, condition)
COUNTIFS
counts rows that meet several conditions at the same time
how many where x and y
=countifs(range 1, condition 1, range 2, condition 2)
SUMIFS
adds up values only in rows that meet several conditions at once
SUMIF
adds up values only in rows that meet one condition
clustered column chart
to compare values across categories (sales per month, per region)

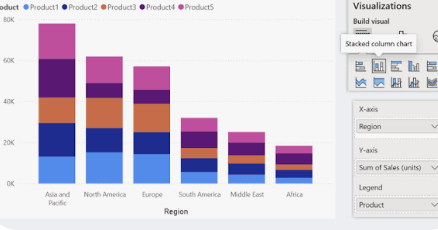
stacked column
one bar per category, split into segments. use when you want to total and see what makes it up
100% stacked column
every bar is same hight, split into shares. use it when only the proportions matter, not the size of the totals

3-d column
column chart w/ depth

stock charts
shows open, high, low, and close prices(plus volume)

bubble chart
A bubble chart expands a standard scatter plot by plotting three variables: the X-axis (horizontal value), the Y-axis (vertical value), and the bubble size (third dimension)

radar chart
several measurements arranged around a center, like a spider web. Use it to compare a profile against a target

map chart
colors countries or regions by valye
waterfall
starting value to ending value (bridge rev to profit)
funnel chart
shows stages that are shrinking w/ a drop off b/w them
use for sales or conversion pipelines
line
a value changing over time; use it for trends
pie
shows parts of one whole at one moment eg. mkt share
bar
like column but horizontal; use for long category names
what are conditional formats for
to color or style cells automatically depending on their value, following a rule
w/ large tables that are hard to analyze by eye
importing data
brings data from a text (“flat”) file into excel without retyping it
naming cells and ranges
gives a cell or range a word as its name, so you can use the name in formulas instead of the address
define name
a meaningful, descriptive label assigned to a cell, a range of cells, a constant value, or a formula
use when referencing other sheets, in complicated forumals, using constand values, or creating dynamic formulas
create from selection
if labels already sit next to cells
apply names
If formulas already exsist
paste names
writes out a list of all names and ranges they refer to
DATE(yr,mth,day)
use when defining parts of the date are in a diff cell
TODAY()
gives todays date from the computer
use for days overdue, days until deadline ages
NOW()
gives todays date + current time
WEEKDAY(Date, [type])
gives days of the week as number
DAYS360(start;end)
counts days b/w two dates using a 360-day year
YEAR(date), MONTH(DATE), Day(DATE)
pull out one part of a date
EDATE(start;months)
gives same day a # of months earlier or later
EOMONTH(start;months)
gives the last day of the month that many months away (month end payments)
WORKDAY(start; # of working days; [holidats])
calculates a future or past date by adding or subtracting a specified number of working days while automatically skipping weekends (Saturdays and Sundays) and optional holidays
delivery date, due date
NETWORKDAYS(start;end;[holidays])
calculates the number of whole working days between a start date and an end date, automatically excluding Saturdays and Sundays ex payroll, days work
DATEIF(start;end;”unit”)
alculates the difference between two dates in years, months, or days using the syntax
(“d”), months (“m”) or years (“y”)
what does goalseek do
performs reverse calculations to find an unknown input value required to reach a specific target result in a formula “what value do I need to reach a target”
loans, break even, budgeting
data table
recalculates results for a whole list of input values at once (sensitivity analysis). It works with one input and one results (what happens to the result if this input takes each of these values)
scenario manager
lets you create, save, and switch between multiple sets of input values to see how they affect your formula results
pivot tables
turns long list into a summary table of totals, averages, or counts, arraged however you want. to summarize by category
filter
shows only rows that meet your criteria and hide rests data doesnt chage
sort
reorders rows by one or more criteria, called levels ex) providence then within province
outline
groups rows or columns so they can be collapsed and expanded