data handling and anaylsis
 Call Kai
 Learn
Learn Practice Test
 Spaced Repetition
 Match
Match Flashcards
 Knowt Play
1/21

There's no tags or description
Looks like no tags are added yet.
Name | Mastery | Learn | Test | Matching | Spaced | Call with Kai | Chat |
|---|
No analytics yet
Send a link to your students to track their progress
22 Terms
What are primary and secondary data?
Primary: authentic data obtained from the participants themselves for the purpose of a particular investigation
Secondary: data that has already been collected before
What is qualitative data?
Non-numerical,usually written or a transcript of spoken word or behaviour, and provides insights into feelings and thoughts that quantitative data cannot
Can be derived from a variety of media
What are the disadvantages of qualitative data?
Subjectivity of the data
Cannot be replicated
What are examples of qualitative data in clinical psychology?
Nurses observations in daily reports
Results of clinical interviews
Diary analysis
What is quantitative data?
Numerical values, statistics, data…
What are the levels of measurement?
Nominal data: most basic and least precise
Data is put into tally charts/categories - categorical data
Gives very little information
Ordinal data:
Data is put into rank order
But, units of measurement are not equal, definable size
Questionnaires that yield a numerical value are ordinal
Internal data: most precise
Equal gap between each unit of measurement (e.g. cm, m, kg…)
What is correlation? How to describe them?
Correlation states the strength and direction of an association/link between 2 or more co-variables
these are plotted on scattergrams
Positive correlation: as one variable rises, the other rises too
Negative correlation: as one variable rises, the other falls
Zero/no correlation: no link between co-variables at all
Co-variables: the variables investigated within a correlation
investigates a link between variables, instead of cause and effect relationship (causal relationship)
What are correlation coefficients?
A statistical method for assessing the strength of a correlation
the sign (+ or -) gives the direction
The number (between 0 and 1) gives the strength
(E.g. -1: strong negative correlation, 0: no correlation, +1: strong positive correlation)
Statistical tests:
Spearman’s rank
Pearson’s product moment correlation
What type of statistical test is suitable for what type of data?
Ordinal
Spearman’s
Internal
Pearson’s
(Ordinal data = Spearman’s Rho, Internal data = Pearson’s Product Moment Correlation)
If one co-variable is ordinal and other one is internal, go with Spearman’s)
What are the strengths and limitations of correlations? -evaluation
Strengths:
Precise and quantifiable measure of how 2 co-variables are related
May suggest possible further research if variables are strong related
Used as a starting point to access possible patterns between variables
Relatively quick and economical to carry out
Limitations:
Lack of experimental manipulation and control - cannot tell why variables are related
Cannot demonstrate causal relationship between variables - don’t know which variable is causing change
Third variable problem: another untested variable is causing the relationship between the 2 co-variables - an influencing variable =correlations an be misused or misinterpreted
What are the different types of statistical tests for tests of difference?
Repeated:
Nominal - sign test, Ordinal - wilcoxon, Internal - related T test
Independent:
Nominal - chi squared, Ordinal - mann-whitheyu, Internal - unrelated T test
RINO SC WM IRU
What is coding in content analysis?
Coding unites: the catagories
Coders: records the data in the categories (e.g. the number of occurrences of a particular coding category) - nominal level of measurement (frequencies)
What are descriptive statistics? What are the 2 types of measures?
Descriptive statistics describe features of the data - How spread out is the data? How is the data clustered together?
Measures of dispersion: range, standard deviation
Measures of central tendency: mean, median, mode
What is the mode? How to calculate it? What are the advantages and disadvantages?
The mode is the value or event that occurs the most frequently
It is the most suitable measure of central tendency for nominal data
+: Not influenced by extremes values
+: Useful to show most popular value
-: Crude measure of central tendency
-: Not useful if many equal modes
What is the median? How to calculate it? What are the advantages and disadvantages?
The middle value when all values are placed in rank order
The most suitable measure of central tendency for ordinal data
+: Not distorted by extreme freak values
-: Can be distorted by small samples
-: Less sensitive
What is the mean? How to calculate it? What are the advantages and disadvantages?
The average value of all scores
The most suitable measure of central tendency for interval or ratio data
+: Most sensitive measure of central tendency of all data
-: Can be distorted by extreme freak values
What is the range? How to calculate it? What are the advantages and disadvantages?
The difference between the smallest and largest value
+: Quick and easy to calculate
-: Distorted by extreme freak values
What is the standard deviation? What are the advantages and disadvantages?
The average amount all values deviate from the mean
-3 -2 -1 mean(0) 1 2 3
+: The most sensitive measure of dispersion, using all the data available
+: Can be used to relate the sample to the population’s parameters
-: A little more time consuming to calculate but no important disadvantages
What are the types of graphical descriptive statistics?
Nominal data
Bar charts
Pie charts
Ordinal / Interval data - continuous data
Histograms
Frequency polygon
Correlations
Scattergrams
They display quantitative data
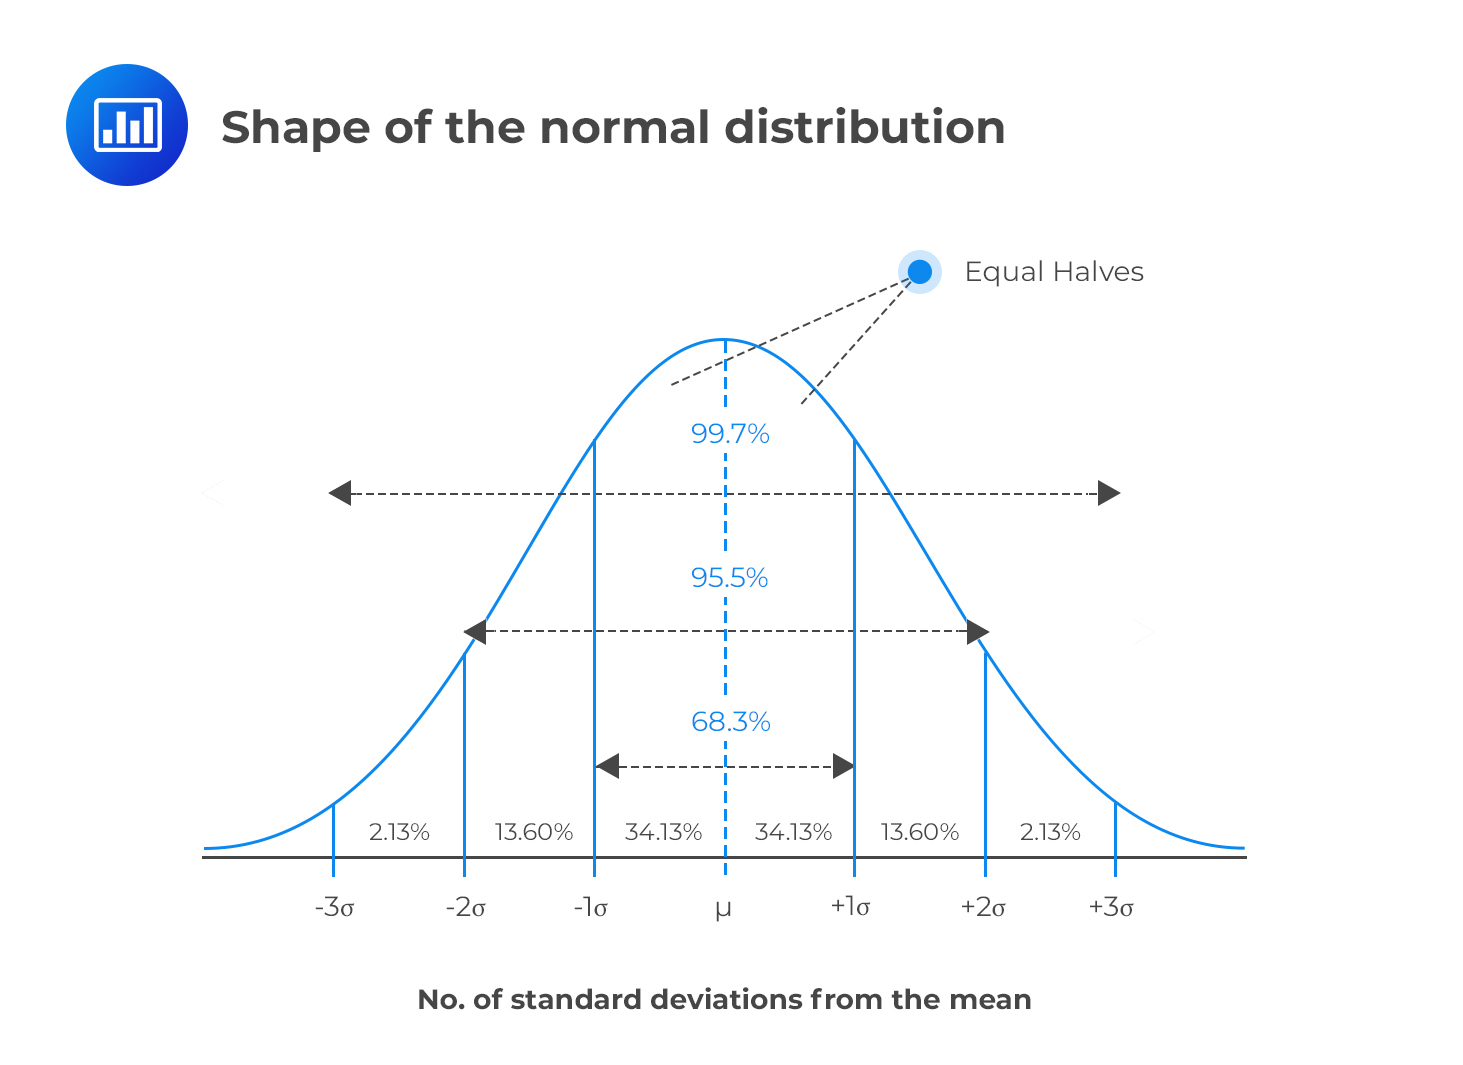
What is normal distribution?
Bell shapes - the Bell Curve
Symmetric at the midpoint where the mode, media and mean all fall
The percentage of values covered by the areas between the standard deviations of the curve are known
Never touched the x axis
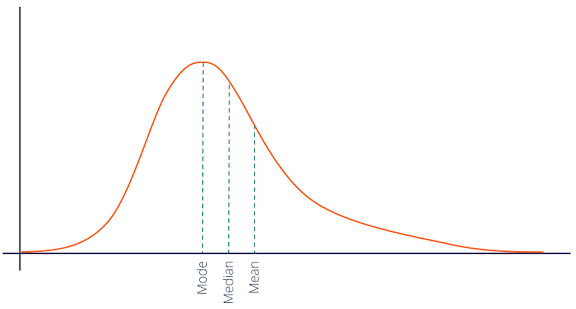
What is a positive skewed distribution?
X-axis: mean > median > mode
Mean, median and mode, going up the road
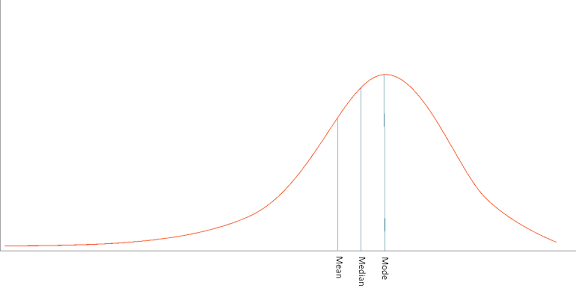
What is a negative skewed distribution?
X-axis: mean < median < mode
Mean, median an mode, going up the road