Aggregate Demand and Aggregate Supply
 Call Kai
 Learn
 Practice Test
 Spaced Repetition
 Match
 Flashcards
 Knowt Play
1/59

Earn XP
Description and Tags
Practice vocabulary flashcards covering the components, shifts, and determinants of the Aggregate Demand-Aggregate Supply (AD-AS) model and Aggregate Expenditures framework.
60 Terms

Suppose the economy is currently at full employment with aggregate demand curve AD2. A further increase in consumption and investment spending will cause
D. demand-pull inflation, and the new equilibrium output will be more than Y2
An increase in expected future income will
A. decrease aggregate demand and aggregate supply.
B. increase aggregate demand.
C. increase aggregate demand and aggregate supply.
D. increase aggregate supply.
B. increase aggregate demand.
If the dollar appreciates in value relative to foreign currencies, aggregate demand
A. decreases because net exports decrease.
B. increases because consumption increases.
C. decreases because consumption decreases.
D. increases because net exports increase.
A. decreases because net exports decrease.

Use the following graph to answer the next question.
A shift from AD2 shifts to AD1 would be consistent with what economic event in U.S. history?
A. World War II in the 1940s
B. cost-push inflation in the mid-1970s
C. Great Recession of 2007–2009
D. demand-pull inflation in the late 1960s
C. Great Recession of 2007–2009

Use the following graph to answer the next question.
A shift of the aggregate demand curve from AD1 to AD2 might be caused by a(n)
A. increase in aggregate supply.
B. decrease in net export spending.
C. decrease in the amount of output supplied.
D. increase in investment spending.
D. increase in investment spending.
An increase in the aggregate expenditures schedule
A.decreases aggregate demand by the amount of the increase in aggregate expenditures.
B. increases aggregate demand by the amount of the initial increase in aggregate expenditures times the multiplier.
C. increases aggregate demand by the amount of the increase in aggregate expenditures only
D. decreases aggregate demand by the amount of the initial increase in aggregate expenditures times the multiplier.
B. increases aggregate demand by the amount of the initial increase in aggregate expenditures times the multiplier.
Inflation caused by a rise in the prices of inputs is referred to as
A. unexpected inflation.
B. cost-push inflation.
C. demand-pull inflation.
D. Hyperinflation.
B. cost-push inflation.
In the aggregate demand-aggregate supply model, the economy’s price level is assumed to be
A. constant, unlike in the aggregate expenditures model.
B. constant, just like in the aggregate expenditures model.
C. variable, just like in the aggregate expenditures model.
D. variable, unlike in the aggregate expenditures model.
D. variable, unlike in the aggregate expenditures model.
Suppose that oil prices increase sharply while the rate of growth in labor productivity declines. The combination of these two factors should
A. shift the short-run aggregate supply curve to the left.
B. shift the short-run aggregate supply curve to the right.
C. shift the aggregate demand curve to the left.
D. shift the aggregate demand curve to the right.
A. shift the short-run aggregate supply curve to the left.

Use the following graph to answer the next question.
Which of the following factors does not explain a movement along the AD curve?
A. the interest-rate effect
B. the real-balances effect
C. the foreign purchases effect
D. the expenditure multiplier effect
D. the expenditure multiplier effect
The labels for the axes of an aggregate supply curve should be
A. real employment for the vertical axis and price level for the horizontal axis.
B. aggregate demand for the vertical axis and real national output for the horizontal axis.
C. real domestic output for the vertical axis and price level for the horizontal axis.
D. real domestic output for the horizontal axis and price level for the vertical axis.
D. real domestic output for the horizontal axis and price level for the vertical axis.
12. An increase in the price level in the aggregate expenditures model would
A. decrease aggregate expenditures and shift the AD curve to the left.
B. increase aggregate expenditures and shift the AD curve to the right.
C. increase aggregate expenditures but would not shift the AD curve.
D. decrease aggregate expenditures but would not shift the AD curve.
D. decrease aggregate expenditures but would not shift the AD curve.
A decrease in labor costs will cause aggregate
A. supply to increase.
B. demand to decrease.
C. supply to decrease.
D. demand to increase.
A. supply to increase.
If government purchases increase by $10 billion and the economy's MPC is .8, the aggregate demand curve will shift
A. rightward by $10 billion at each price level.
B. leftward by $50 billion at each price level.
C. rightward by $50 billion at each price level.
D. leftward by $40 billion at each price level.
C. rightward by $50 billion at each price level.
First, calculate the expenditure multiplier using the formula: $\text{Multiplier} = 1 / (1 - \text{MPC})$.
Plug in the given Marginal Propensity to Consume (MPC of 0.8): $\text{Multiplier} = 1 / (1 - 0.8) = 1 / 0.2 = 5$.
Multiply the initial change in government spending by the multiplier to find the total shift in aggregate demand: $\10 \text{ billion} \times 5 = \50 \text{ billion}$.
Because government purchases are a component of aggregate demand, an increase shifts the AD curve to the right.
The economy experiences an increase in the price level and a decrease in real domestic output. Which of the following is a likely explanation?
A. Input prices have increased.
B. Government regulations have been reduced.
C. Productivity has increased.
D. There has been an increase in government spending.
A. Input prices have increased.
A decrease in business taxes will tend to
A. decrease aggregate demand.
B. increase aggregate supply.
C. increase aggregate demand but not change aggregate supply.
D. increase aggregate supply but not change aggregate demand.
B. increase aggregate supply.

The massive increase in government spending during World War II moved the economy in the span of a few short years from mass unemployment and price stability to "overfull" employment. This situation can be best illustrated in the figure above as a
A. shift from AD1 to AD2
B. shift from AD2 to AD1
C. movement along AD2 from Y2 to Y3
D. movement along AD1 from Y4 to Y1
A. shift from AD1 to AD2

Use the following graph to answer the next question.
Which of the following changes will shift AD1 to AD2
A. a decrease in personal and business taxes
B. an increase in real interest rates
C. an increase in the value of the dollar relative to other currencies
D. a shrinkage in the value of stocks and other financial assets
A. a decrease in personal and business taxes
19. When national income in other nations decreases, aggregate demand in our economy
A. increases because our imports will decrease.
B. increases because our exports will increase.
C. decreases because our exports will decrease.
D. decreases because our imports will increase.
C. decreases because our exports will decrease.
The foreign purchases, interest rate, and real-balances effects explain why the
A. aggregate expenditures schedule may shift up or down.
B. aggregate demand curve is downward-sloping.
C. aggregate demand curve may shift to the left or right.
D. economy will adjust towards equilibrium.
B. aggregate demand curve is downward-sloping.
Use the following graph to answer the next question.
In the diagram, Y* is the full-employment output. If the economy's current aggregate demand curve is AD0, it would be appropriate for the government to
A. increase government purchases or reduce taxes.
B. reduce government purchases or increase taxes.
C. reduce unemployment compensation benefits.
D. reduce government purchases and taxes by equal-size amounts.
A. increase government purchases or reduce taxes.
If a government wants to pursue an expansionary fiscal policy, then a tax cut of a certain size will be more expansionary when the
A. economy's MPC is small.
B. unemployment rate is low.
C. economy's MPC is large.
D. economy's MPS is large.
C. economy's MPC is large.
The time that elapses between the beginning of a recession or an inflationary episode and the identification of the macroeconomic problem is referred to as a(n)
A. recognition lag.
B. legislative lag.
C. implementation lag.
D. budget lag.
A. recognition lag.

Use the following figure to answer the next question.
The economy is at equilibrium at point A. What fiscal policy would be most appropriate to control demand-pull inflation?
A. Shift aggregate supply by increasing taxes.
B. Shift aggregate demand by increasing government purchases.
C. Shift aggregate demand by increasing taxes.
D. Shift aggregate demand by decreasing taxes.
C. Shift aggregate demand by increasing taxes.
5. The lag between the time that the need for fiscal action is recognized and the time action is actually taken is referred to as the
A. legislative lag.
B. recognition lag.
C. implementation lag.
D. spending lag.
A. legislative lag.
Contractionary fiscal policy tends to ________
consumption because it may reduce ________
A. increase; disposable income.
B. reduce; savings.
C. reduce; disposable income.
D. increase; savings.
C. reduce; disposable income.
If government finances fiscal policy through additional borrowing, it could affect the loanable funds market by causing
A. an increase in the quantity demanded and an increase in the quantity supplied for loanable funds.
B. an increase in the quantity demanded and an increase in supply for loanable funds.
C. an increase in the demand and an increase in the quantity supplied for loanable funds.
D. an increase in the demand and an increase in supply for loanable funds.
C. an increase in the demand and an increase in the quantity supplied for loanable funds.
Unemployment compensation is
A. not an automatic stabilizer.
B. an automatic stabilizer because it rises as income increases, slowing an economic expansion.
C. an automatic stabilizer because it falls as income increases, slowing an economic expansion.
D. an automatic stabilizer because it falls as income decreases, slowing an economic contraction.
C. an automatic stabilizer because it falls as income increases, slowing an economic expansion.
Which of the following serves as an automatic stabilizer in the economy?
A. the inflation rate
B. exchange rates
C. interest rates
D. the progressive income tax
D. the progressive income tax
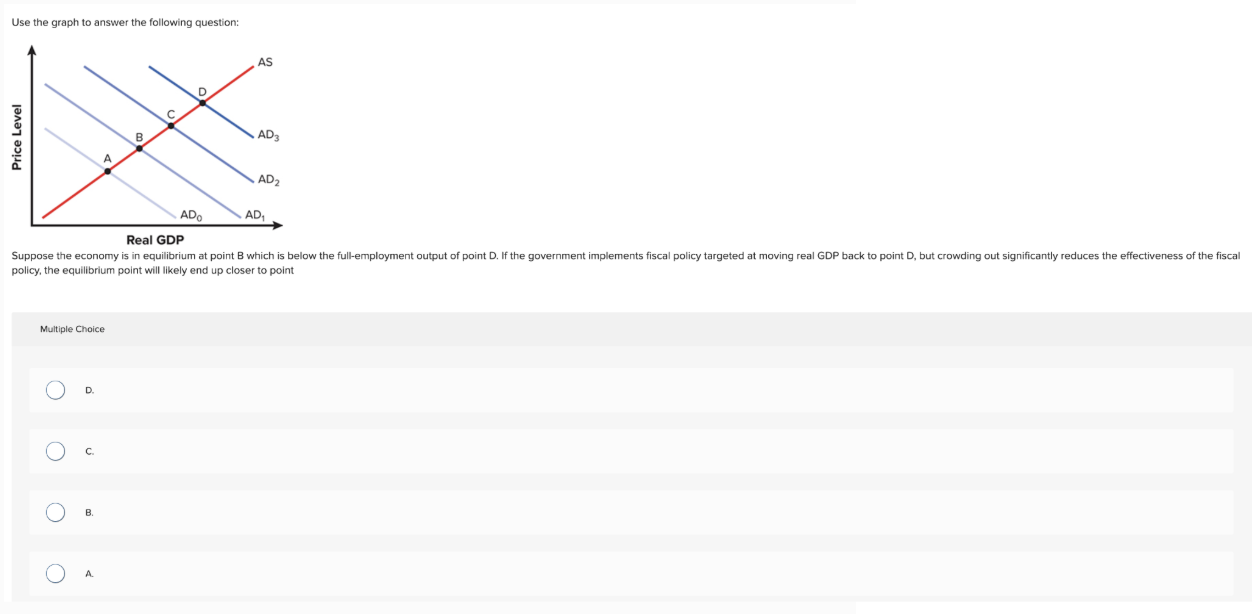
Use the graph to answer the following question:
Suppose the economy is in equilibrium at point B which is below the full-employment output of point D. If the government implements fiscal policy targeted at moving real GDP back to point D, but crowding out significantly reduces the effectiveness of the fiscal policy, the equilibrium point will likely end up closer to point
A. D.
B. C.
C. B.
D. A.
B. C.

You are given the following information about aggregate demand at the existing price level for an economy:
consumption = $\$500</span><span>billion,</span></p></li><li><p><span>investment=</span><spanstyle="line−height:1.15;">\50 billion,
government purchases = $\$100</span><span>billion,and</span></p></li><li><p><span>netexports=</span><spanstyle="line−height:1.15;">\20 billion. If the full-employment level of GDP for this economy is $\$620$ billion,
then what combination of actions would be most consistent with closing the GDP-gap here?
A. An increase in government purchases and a decrease in taxes
B. An increase in government purchases and taxes
C. A decrease in government purchases and taxes
D. A decrease in government purchases and an increase in taxes
D. A decrease in government purchases and an increase in taxes

Use the graph to answer the following question:
If the market for investment is initially in equilibrium at point A, but then implementation of fiscal policy causes crowding out to occur, the equilibrium in the market will likely
A. move toward point B.
B. move toward point C.
C. move toward point D.
D. remain at point A.
A. move toward point B.
Assume that the full-employment level of output is $1,000 and the price level associated with full-employment output is 100. Also assume that the economy's current level of output is $1,100 and at the price level of 100 current aggregate demand is $1,200. If the government moves the economy back to the full-employment level of output by increasing taxes by $50, then the expenditures multiplier equals
A. 2.
B. 4.
C. 5.
D. 10.
C. 5.

Here is the text from the image, formatted for easy copying and pasting:
Use the following graph to answer the next question.
The economy is at equilibrium at point B. What would expansionary fiscal policy do?
A. Move the economy from point B downward along AD2
B. Move the economy from point B towards point C.
C. Move the economy from point B upward along AD2
D. Move the economy from point B towards point A
D. Move the economy from point B towards point A

Use the following graph to answer the next question.
Suppose an economy's full employment output is at the level Y1, and the economy's current aggregate demand is represented by AD2. If the government swiftly implements contractionary fiscal policy that immediately shifts the economy's aggregate demand to AD1, the short-to-medium term aggregate demand would be most closely represented by
A. AD2
B. AD1
C. AD0
D. AD3
C. AD0
16. A country’s government plans a $2 billion increase in government purchases in hopes of increasing real GDP in the economy by $40 billion. The plan would work if the MPS for this economy is
A. 0.25.
B. 0.1.
C. 0.2.
D. 0.05.
D. 0.05.
If the economy falls into a recession, automatic stabilizers will cause
A. tax receipts to fall and government spending to rise.
B. both tax receipts and government spending to rise.
C. tax receipts to rise and government spending to fall.
D. both tax receipts and government spending to fall.
A. tax receipts to fall and government spending to rise.
If the economy is producing a level of output $45 billion above full-employment real GDP, the most viable option to shift the output to full-employment GDP would be a
A. tax increase of some amount less than $45 billion.
B. tax increase of $45 billion.
C. tax increase of some amount greater than $45 billion.
D. tax cut of $45 billion.
A. tax increase of some amount less than $45 billion.
You are given the following information about aggregate demand at the existing price level for an economy:
consumption = $\$400</span><span>billion,</span></p></li><li><p><span>investment=</span><spanstyle="line−height:1.15;">\40 billion,
government purchases = $\$90</span><span>billion,and</span></p></li><li><p><span>netexports=</span><spanstyle="line−height:1.15;">\25 billion.
If the full-employment level of GDP for this economy is $\$600$ billion, then what combination of actions would be most consistent with closing the GDP-gap here?
A. An increase in government purchases and a decrease in taxes
B. An increase in government purchases and taxes
C. A decrease in government purchases and an increase in taxes
D. A decrease in government purchases and taxes
A. An increase in government purchases and a decrease in taxes
20. Because of the increasingly global market for loanable funds, crowding out may not cause a significant problem in some ________
countries. However, it can adversely affect economic growth in ________
countries.
A. developed; developing
B. developing; developed
C. developed; other developed
D. developing; other developing
A. developed; developing
Which definition(s) of the money supply include(s) only items that are directly and immediately usable as a medium of exchange?
A. neither M1 nor M2
B. M2
C. both M1 and M2
D. M1
D. M1
Which of the following are liabilities to a bank?
A. capital stock and reserves
B. demand and time deposits
C. vault cash and demand deposits
D. property and capital stock
B. demand and time deposits
To keep high inflation from eroding the value of money, monetary authorities in the United States
A. establish insurance on checkable deposit accounts.
B. create token money that is less than its intrinsic value.
C. control the supply of money in the economy.
D. make paper money legal tender for the payment of debt.
C. control the supply of money in the economy.
4. If, in the market for money, the quantity of money demanded exceeds the money supply, the interest rate will
A. fall, causing households and businesses to hold less money.
B. rise, causing households and businesses to hold more money.
C. fall, causing households and businesses to hold more money.
D. rise, causing households and businesses to hold less money.
D. rise, causing households and businesses to hold less money.
What function is money serving when you deposit it in a savings account?
A. a unit of account
B. a store of value
C. a medium of exchange
D. a checkable deposit
B. a store of value
When a bank accepts a checkable deposit from a customer, its deposits will increase and its excess reserves will
A. increase by the same amount as deposits.
B. increase by more than the deposits.
C. decrease.
D. increase by less than the deposits.
D. increase by less than the deposits.
Luigi is willing to lend Klaus $5,000 for one year at a nominal rate of interest of 7 percent. Both Luigi and Klause expect the rate of inflation to be 2 percent in the next year. If the actual rate of inflation over the year was 1 percent, what is the real return did Luigi receive?
A. 6 percent
B. 4 percent
C. 8 percent
D. 5 percent
A. 6 percent
An increase in nominal GDP will
A. increase the transaction demand and the total demand for money.
B. decrease the transactions demand for money but increase the total demand for money
C. decrease the transactions demand and the total demand for money.
D. increase the transactions demand for money but decrease the total demand for money.
A. increase the transactions demand and the total demand for money.
Which group is responsible for the policy decision of changing the money supply?
A. Federal Advisory Council
B. Office of Management and Budget
C. Federal Open Market Committee
D. Thrift Advisory Council
C. Federal Open Market Committee

Here is the text from the image, formatted for easy copying and pasting:
Use the following given market-for-money diagrams to answer the next question.
The total demand for money is shown by
A. MD,3
B. MD,2
C. MD,1
D. MS
A. MD,3

Interest Rate | Demand for Money (billions) |
7% | $200 |
6 | $300 |
5 | $400 |
4 | $500 |
If the current interest rate is 5 percent, what will be the equilibrium interest rate if the money supply falls by $\$100$ billion dollars?
A. 4 percent
B. 7 percent
C. 5 percent
D. 6 percent
A. Answer: 6 percent
Explanation:
At 5%, money demand is $\$400</span><span>billion,sotheinitialmoneysupplyis</span><spanstyle="line−height:1.15;">\400 billion.
A $\$100</span><span>billiondecreasemakesthenewmoneysupply</span><spanstyle="line−height:1.15;">\300 billion.
Looking at the table, $\$300$ billion in money demand corresponds to an interest rate of 6%.
The functions of money are to serve as a
A. determinant of consumption, investment, and government spending.
B. unit of account, a store of value, and a medium of exchange.
C. resource allocator, a method for accounting, and a means of income distribution.
D. factor of production, exchange, and aggregate supply.
B. unit of account, a store of value, and a medium of exchange.
The required-reserve ratio is equal to a commercial bank’s
A. checkable-deposit liabilities multiplied by its excess reserves.
B. checkable-deposit liabilities divided by its required reserves.
C. excess reserves divided by its required reserves.
D. required reserves divided by its checkable-deposit liabilities.
D. required reserves divided by its checkable-deposit liabilities.
The three functions of money are
A. serving as a medium of exchange, unit of account, and store of value.
B. implementing monetary policy, fiscal policy, and structural policy.
C. measuring balance of payments, exchange rates, and interest rates.
D. spending for consumption, investment, and government purchases.
A. serving as a medium of exchange, unit of account, and store of value.
Who determines the size of the money supply in the United States?
A. the Federal Reserve and the banking system together
B. the Federal Reserve and the Treasury Department together
C. the Treasury Department
D. the Federal Reserve
A. the Federal Reserve and the banking system together
A consumer holds money to meet spending needs. This would be an example of the
A. use of money as legal tender.
B. asset demand for money.
C. transactions demand for money.
D. use of money as a measure of value.
C. transactions demand for money.
When the interest rate in the economy was 10 percent, the price of a bond with no expiration date that pays a fixed annual interest of $500 was $5,000. If the interest rate in the economy falls to 6 percent, the price of this bond will be about
A. $8,333.
B. $5,030.
C. $4,700.
D. $7,128.
A. $8,333.

18. The transactions demand for money is least likely to be a function of the
A. interest rate.
B. level of national income.
C. frequency of wage and salary payments.
D. price level.
A. interest rate.

Answer B. =C

Money functions as a store of value if it allows you to
A. make exchanges in a more efficient manner.
B. delay purchases until you want the goods.
C. measure the value of goods in a reliable way.
D. increase your confidence in money.
B. delay purchases until you want the goods.