Coding Commands
 Call Kai
 Learn
Learn Practice Test
 Spaced Repetition
 Match
Match Flashcards
 Knowt Play
1/24

There's no tags or description
Looks like no tags are added yet.
Name | Mastery | Learn | Test | Matching | Spaced | Call with Kai | Chat |
|---|
No analytics yet
Send a link to your students to track their progress
25 Terms
!
Equivalent to not
[]
Selects specific items in the dataset
Where is rows and columns in []
[row, column]
exclude = NULL
Separates NA into their own category
dim()
Shows the number rows then columns
nrow()
Tells you the number of rows
data.frame()
Puts variables into a data set
select()
Picks columns
filter()
Picks rows
level()
Shows the categories for vairables labelled factors
table()
Counts the number of observations for each unique category
colSums()
Sums up the values in each column
ggplot(penguins, aes(x=flipper, y=body)) +
geom_point(color = “blue”, alpha = 0.6))
Makes every point blue
ggplot(penguins, aes(x=flipper, y=body))+
geom_point(aes(color = “blue”))
Creates a legend with the word blue
If alpha is placed inside aes()
Legend is made, and chracteristics not applied because it assumes it’s a variable
If alpha or colour is placed outside aes()
No legend is made, and characteristics applied
facet_wrap(~variable)
Adds multiple separate graphs with the same axis
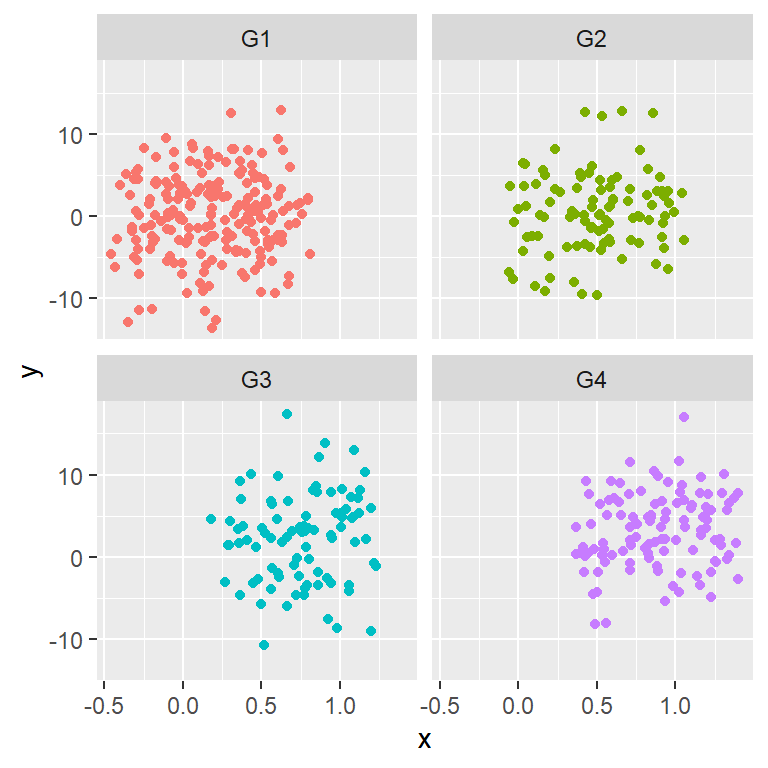
face_grid(variable~variable)
Creates a grid of graphs between two variables
cor(x,y)
Finds pearson’s correlation
lm(y~x)
Predicts linear mnodel
sample()
Randomly picks numbers`
function()
Named chunk of code that can be ran
quantile(c(lower, upper))
Finds intervals
pnorm()
Gives area under the standard normal curve below z (you put in a z score)
qnorm()
Gives z scores for an area (you put in an area and get a z score)