Unit 2 Quiz - Quant. Analysis of Consumer Data
 Call Kai
 Learn
 Practice Test
 Spaced Repetition
 Match
 Flashcards
 Knowt Play
1/81

There's no tags or description
Looks like no tags are added yet.
82 Terms
A change in Xn leads to a Bn -unit change in our prediction of Y,
holding all other X’s constant
what are the two main regression coefficient goals?
isolate the impact of individual predictors, controlling for other predictors (i.e holding those other predictors constant)
compare how strongly each predictor is related to the outcome
what are the two main model fit goals?
improve model predictions
determine how much of the model’s predictive performance is attributable to each predictor
when comparing different units
use standardized coefficients
holding other predictors constant helps with
multicollinearity
regression coefficients
quantify change in the original units of the outcome and predictor variables
standardized regression coefficients
quantify change in terms of standard deviations
Effect Size vs. Significance
Both are valuable metrics, as they answer different questions
Tests of statistical significance use sample data to
make a probabilistic inference about whether an effect exists at the population level
if we observe a greater share of the population, we have more confidence in that inference
Effect sizes express how large the effect is in our specific sample
Sample size doesn’t matter because we are not trying to generalize outside the sample
When predictors are highly correlated, they move together (multicollinearity)
Thus, measuring the impact of the predictor holding the others constant is difficult and/or misleading
We measure multicollinearity with the
VIF (variance inflation factor)
VIF =
How much does multicollinearity affect estimate of βi?
Calculation is outside the scope of this class
Why do we care about the VIF?
High VIF → unreliable estimates → remove Xi if βi is unreliable
Improving Model Fit
How well does the model help us make predictions?
To assess how well the model helps us make predictions, we assess the:
In- vs. out-of-sample fit
Model validation methods
Overfitting
Incremental R² shows us
How much does each predictor improve our predictions?
Fit: model = regmod(Y ~ X, data = training_data) →
Use "model" to predict Y for all data points in test_data
Why do we prefer k-fold CV to the train-test validation model?
We prefer k-fold CV to a simple train/test validation because it doesn't rely on one specific random split
Assessing Overfitting
If there is a large gap between in-sample and out-of-sample fit, we have an overfitting problem.
A model can have a high in-sample R² for two reasons:
It captures true underlying relationships between X's and Y
It captures small, random patterns that are idiosyncratic to that particular sample
It captures true underlying relationships between X's and Y
It captures small, random patterns that are idiosyncratic to that particular sample
In-sample R² cannot separate those two. Both improve fit
Out-of-sample R² cannot benefit from (2) because the sample used to measure prediction error was not used to estimate the model. Only (1) can improve out-of-sample predictions
A large gap between in-sample and out-of-sample R² means a lot of the in-sample R² was driven by (2)
R²
% reduction in prediction error vs. always guessing the mean
Which predictor(s) are driving that prediction error reduction in the model?
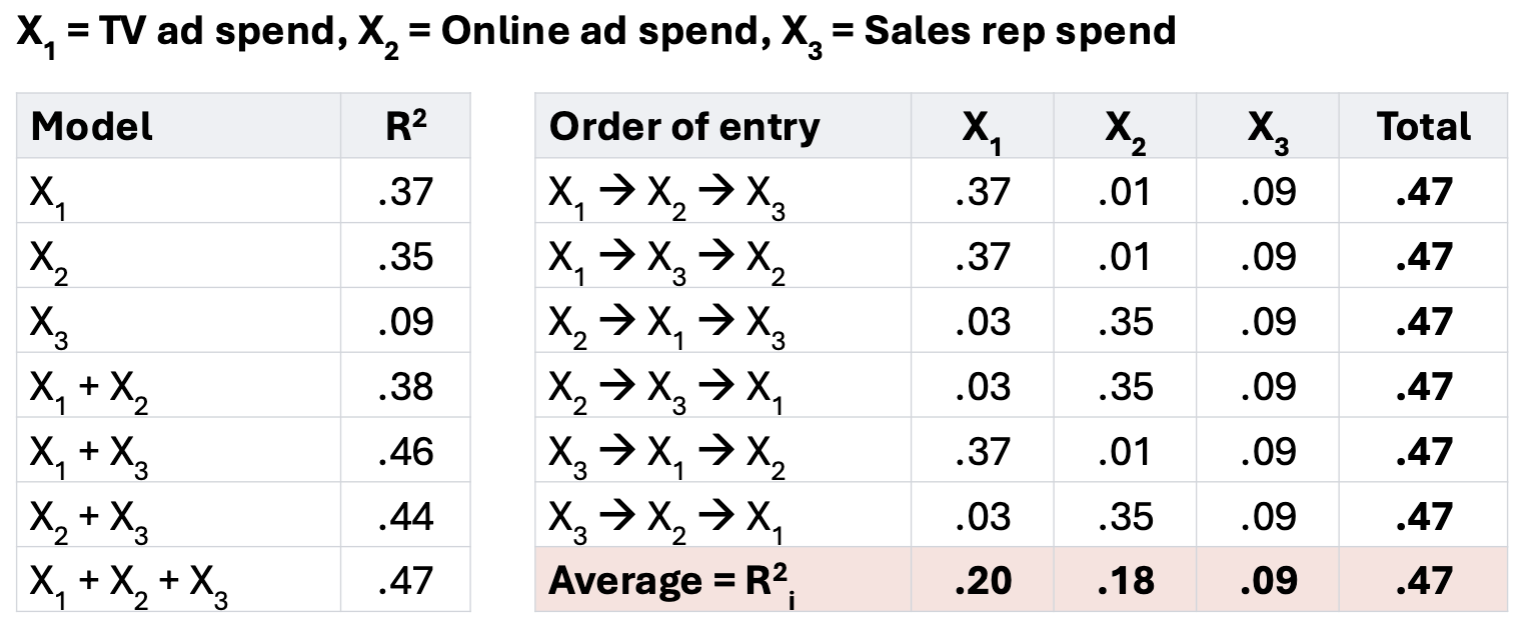
R²i = how much of that error reduction is attributed to including Xi in the model
The pieces add up to the R² of the model
The catch about R²i: correlated predictors carry redundant information
How much Xi improves predictions depends on what is already in the model?
Prediction error from always guessing the mean
See image

Working Example: Y ~ X1 + X2 + X3
Procedure is known as "Shapley value decomposition"
Big topic in ML and interpretable AI
Predictor "Importance"
How important is Xi?
Standardized estimate to assess magnitude?
p-value to assess generalizability?
R²i to assess predictive power?

Out-Of-Sample R²
How well does the model predict new data?
R²
How much does the model improve our predictions?
Validation Info (if needed) for regmod output
Number of folds OR % of sample in test set
Regmod model info
R²
Out-of-sample R²
Validation info
Predictor Info
coefficients
p-values
standardized coefficients
VIF
R²i (or Test Set R²i or CV R²i)
Coefficients
Δ in Xi → Δβi-unit in Ŷ, holding all else constant
p-values
Is βi significantly different from zero?
Standardized Coefficients
βi in standard deviation units
VIF
Effect of multicollinearity on estimate of βi
R²i (or Test Set R²i or CV R²i)
Share of R²i (or Test Set R²i or CV R²i) attributable to Xi
To Include or Not Include X
All else equal, we prefer models with fewer predictors
It's beneficial if we can make predictions that are just as accurate with less information
If we include a predictor, it should be "worth it"
It should meaningfully improve the performance or usefulness of our model without causing multicollinearity or overfitting
Predictor Metric: Coefficient
Potential Reasons to Keep: NA
Potential Reasons to Remove: NA
p-value
Potential Reasons to Keep: p < .05 (or close to it)
Potential Reasons to Remove: p ≥ .05
|Std_Coefficient|
Potential Reasons to Keep:
≥ 0.2 (i.e., not trivial)
large relative to other X’s
Potential Reasons to Remove:
< 0.2 (trivial)
low relative to other X’s
R²i
Potential Reasons to Keep:
High → helping predictions
Low but positive → not hurting
Potential Reasons to Remove:
Low or zero → not helping
VIF
Potential Reasons to Keep:
VIF < 5
VIF < 10 and X is important
Potential Reasons to Remove:
VIF ≥ 10
5 ≤ VIF < 10 and X is not important
Predicting overall satisfaction (hotel example)
Not just a sum of experiences at each part of the process
Consumers place more weight on certain parts
How can we determine how much each part matters for overall customer satisfaction?
β1 =
slope in the direction of X1, holding X2 constant
β2 =
slope in the direction of X2, holding X1 constant
R² still measures how much better our predictions get when using our regression model relative to always guessing the mean
As we add more predictors that are correlated with Y, our best guess for Y| X1 + X2 + … + Xn gets better → We have more information
Which component had the largest effect on overall satisfaction?
• Can we use the coefficients to answer that question?
• Yes, BUT only because all variables are on the same scale
How do you compare a $1 increase in Ad Spend to a 1-star increase in average product rating?
Effect size (for regression, standardized coefficients)
Effect size =
standardized measure of the magnitude of the effect we are interested in
standardized = it does not matter what the scale of the original data is
easy to compare across different predictors and models
So what do we use for this standardized scale?
Standard deviation
Many other measures of effect size (generally less intuitive and/or more niche)
Standard deviation =
unit of position within a variable's distribution
Regression Coefficients =
quantify change in the original units of the outcome and predictor variables
Standardized Regression Coefficients =
quantify change in terms of standard deviations
Interpreting Standardized Coefficients
Standardization is great, but it does make the scale less intuitive
General rule of thumb:
|Standardized Coef|: Trivial <.2 < Small <.5 < Medium <.8 < Large
Careful: these cutoffs are generic and may change in different contexts
Note: standardization in regression works slightly differently for continuous vs. categorical predictors
Coefficient always means the predicted standard deviation change in the outcome when the predictor changes
Continuous: as predictor increases by two standard deviations
Categorical: as predictor switches categories
Impact is Not All About Significance
The other reason we need effect sizes is because of the limitations of p-values
Thus far, we have been focused on statistical inference
Let’s assume we run a statistical test and reject H0
There is a significant effect
How big is that effect?
We can’t just look at the p-value
p-values tell us about the generalizability of the effect we observed, not the magnitude of that effect
Effect Size vs. Significance
Both are valuable metrics, as they answer different questions
Tests of statistical significance use sample data to make a probabilistic inference about whether an effect exists at the population level
If we observe a greater share of the population, we have more confidence in that inference
Effect sizes express how large the effect is in our specific sample
Sample size doesn’t matter because we are not trying to generalize outside the sample
βi = change in model's prediction of Y if we change Xi by one unit (or category), holding all other predictors constant
Scale is in raw units
Standardized βi = quantifies the magnitude of βi for comparisons across predictors and models
Standardized scale (unit = standard deviation)
Model R² = variance in Y explained by the regression model
Range = [0, 1)
Why use multiple regression?
Improve model fit
Isolate impact of one predictor while controlling for other predictors
Compare effect sizes across predictors on different scales
BUT, multiple regression opens up a couple potential drawbacks…
Multiple Regression Pitfalls
Adding more predictors can be great
Improves our model fit (i.e., best guess of Y)
Allows use to assess relative importance of different predictors
Two potential issues:
Overfitting
Multicollinearity
R² measures
how well our model improves predictions of the outcome variable
We often want to estimate a model based on
existing customer data and use it to predict future customer behavior
A good model uncovers the underlying relationship between variables, allowing us
to make accurate predictions
An overly complex model learns
idiosyncratic patterns of a particular sample that may not generalize to the general population
Memorizing vs. understanding
Overfitting Scenario
We have data on…
Y = outcome variable
X1 = predictor variable that IS significantly related to Y
X2 , …, X21 = 20 other potential predictors that are NOT significantly related to Y
We fit 3 regression models
1) Y ~ X1
2) Y ~ X1 + … + X11
3) Y ~ X1 + … + X21
Even though X1 is the only significant predictor, adding additional
predictors is likely to improve model fit due to random correlation
R² is simply a measure of in-sample model fit
It doesn't estimate how well the model will make predictions for new data
Pseudo-solution = Adjusted R2
Penalizes R2 when extra predictors are added to the model
All else equal, we prefer models with fewer predictors → It's beneficial if we can make predictions that are just as accurate with less information
All good? Not quite
It is still a measure of in-sample fit
Treats all predictors as equally important
Better solution? → directly measure out-of-sample fit
model validation refers to
methods where we measure our model fit based on its predictive accuracy
the generic procedure for model validation is as follows
1. We split our dataset into parts (many ways to do this)
2. Fit the model on part of the data (as we’ve done in the past)
3. Use it to make predictions on the remaining data
4. Measure how accurate those predictions are
Train/Test Split Method
Simplest method
1. Randomly assign 80% of the data to be the “training set” and
the other 20% is the “test set” (exact percentages can vary)
2. Fit a regression (or several) using only the training set
3. Use that model + the values of the predictor variables in the test set to predict the outcome variable in the test set
4. Measure prediction accuracy
Train/Test Validation Drawback:
The results depend on how you split the data. A lucky or unlucky split can make your model look better or worse than it really is.
Solution? → Repeat the process multiple times with different splits and average the results (i.e., cross-validation)
How Many Folds for CV?
• Rule-of-thumb default is to use 10 folds
• Leave-one-out Cross-Validation (LOOCV):
• "Special" form of K-fold cross-validation where K = number of observations
Regmod model performance issue
When predictors are highly redundant, the model doesn't know which one is driving the predictive power
Multicollinearity
We measure multicollinearity with the VIF (variance inflation factor)
VIF = How much does multicollinearity affect estimate of βi?
→ Calculation is outside the scope of this class
Why do we care?
High VIF → unreliable estimates → remove Xi if βi is unreliable
VIF Rules of Thumb
We calculate a VIF for each predictor:
• VIF = 1: No effect of multicollinearity
→ No reason to remove Xi
• 1 < VIF < 5 : Small effect of multicollinearity on βi
→ No reason to remove Xi
• 5 ≤ VIF < 10: Moderate effect of multicollinearity on βi
→ Can keep Xi if it's important in some way. Drop if unnecessary
• 10 ≤ VIF: Large effect of multicollinearity on βi
→ Xi should be removed
Adding more predictors can improve fit but risk overfitting
Smaller models may lead to more error (aka high bias). However, their estimates will be more stable from sample to sample (aka low variance)
Larger models may reduce error (aka low bias). However, their estimates may vary greatly from sample to sample (aka high variance)
What is the optimal tradeoff for model selection?
Based on our objective, we decide if adding/keeping a predictor improves that balance
Note on Other Methods
There are other "off-the-shelf" methods you may come across (especially with AI) that automatically choose the "best" set of predictors. For example…
• Stepwise regression
• AIC optimization
• LASSO regression
• etc.
DO NOT USE THESE
1) It does not help build understanding of the metrics we learned
2) Deterministic criteria may not fit our goals
3) Well-known statistical drawbacks