Psyc Stats Midterm Prep
 Call Kai
 Learn
Learn Practice Test
 Spaced Repetition
 Match
Match Flashcards
 Knowt Play
1/67

There's no tags or description
Looks like no tags are added yet.
Name | Mastery | Learn | Test | Matching | Spaced | Call with Kai | Chat |
|---|
No analytics yet
Send a link to your students to track their progress
68 Terms
Which of the following best describes central tendency?
A statistical measure representing the typical score in a distribution
Which measure of central tendency is most resistant to outliers?
Median
T/F If all values of a variable have equal importance you’d use the weighted mean
False
A distribution has a mean of 16 and a median of 23. This distribution is most likely:
Negatively Skewed
In a perfectly symmetrical distribution with one mode, which is true?
Mean = Median = Mode
Which measure of central tendency is always an actual data point from the dataset?
Mode
T/F In a bimodal distribution, there are no peaks.
False
If the sum of scores (ΣΧ) = 150 and the same size (n) = 10 which is the sample mean?
15
Which can be a cause of outliers?
All of the above - Natural variability, errors in data entry, errors in variable measurement
T/F The mode can be used for both numerical and categorical data
True
T/F Adding or subtracting a score will not change the mean.
False
T/F The range uses only the largest and smallest values in a dataset.
True
Which measure of spread is MOST affect by outliers?
Range
If two classes have the same average test score, but one has a higher standard deviation, what does this tell us?
One class has scores more spread out than the other
T/F Two datasets can have the same mean but different standard deviations.
True
T/F Variance and standard deviation always have the same units as the original data
False
What happens to standard deviation if all values in a data set are increase by 2?
All values stay the same
In which situation would IQR be most useful?
When there are extreme outliers
T/F Range tells us more than standard deviation
False
If a data sets range is 0, what must be true?
All values must be the same
T/F The interquartile range is always small then the range.
True
T/F The IQR divides the data into five parts
False
T/F The larger the standard deviation, the more spread out the data is.
True
T/F The null hypothesis assumes that there is no effect or difference.
True
A smoke alarm rings when there is not actually a fire. This is a:
Type I error
Which factor increase the power of a statistical test?
Larger sample size
T/F Failing to reject the null hypothesis means that the null hypothesis is definitely true.
False
Why do researchers do hypothesis testing?
To make data-driven decision about whether an effect exists
T/F A one-tailed test can only detect an effect in one specified direction
True
Which of the following best describes the relationship between the null hypothesis and the alternative hypothesis?
They are mutually exclusive; if one is true, the other must be false
T/F Decreasing the sample size generally makes it easier to detect a true effect.
False
If the p-value is less than the significance level (a), and you reject the null hypothesis, what does this mean?
There is meaningful difference or effect.
T/F Effect size refers to how big or meaningful a difference or relationship is.
True
Degrees of freedom for a one sample t-test is calculates as:
n - 1
T/F The z-distribution is wider with fatter tails than the t-distribution
False
Which Cohen’s d is not one of the markers of small, medium, or large effect size.
0.4
T/F A small effect can be statistically significant if the sample size is very large.
True
T/F A wider confidence interval means we are more precise in estimating the population mean.
False
A two-tailed t-test is used when:
You want to test for difference in either direction
Which of these is NOT a common effect size measure?
p-value
Which one is not part of the calculation of t?
population standard deviation
T/F A t-distribution becomes closer to a normal distribution as the sample size increases.
True
What happens to the confidence interval if you increase the sample size?
Gets narrower
What is the mode?
The most frequently occurring score
An ordinal variable:
represents ranked categories
Which of the following is a ratio variable?
Number of tattoos
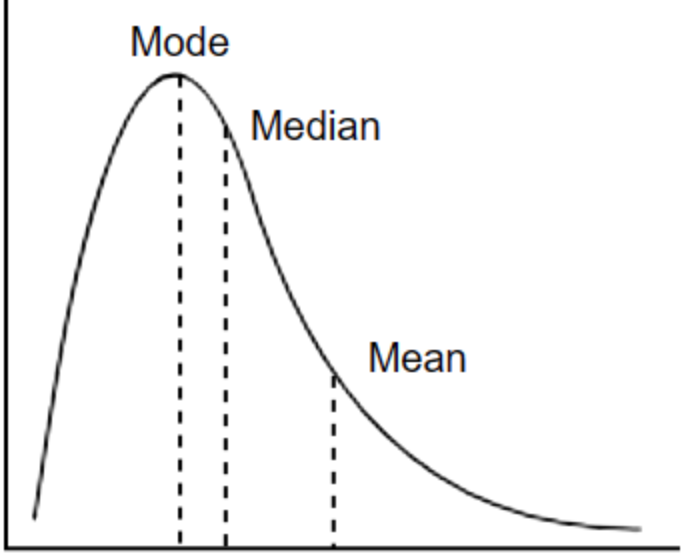
What does this show?
Positive Skew
T/F The IQR is more affected by outliers than the range
False
If one score in a dataset increases, the mean will:
increase
The median is best used when:
The data is skewed
T/F A bimodal distribution has one clear peak
False
T/F A stem-and -leaf plot displays both frequency and actually data values
True
Compared to the z distribution, the t distribution is…. (select all that apply)
Flatter
Has bigger tails
A program DOES work, but researchers fail to find an effect due to small sample size. This is
Type II Error
Variance is:
The standard deviation squared
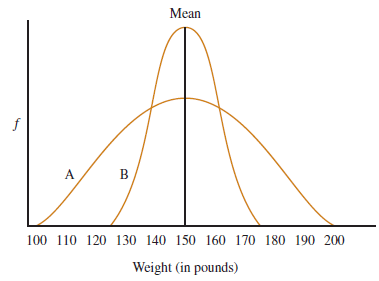
What is true about these distributions: (select all that apply)
They have the same mean
They have different variability
T/F As sample size increase, the t distribution becomes more normal
True
Degrees of freedom for t-tests are calculated as:
n - 1
A positive pregnancy test when someone is not actually pregnant is an example of a:
Type I Error
On a test, most students scored in the 90s, but a few score int eh 20s and 30s. What would this distribution look like?
Negatively skewed
T/F In a bar chart, the bars touch to show that the data are continuous and intervals are connected.
False
What does this symbol indicate? ơ
Population standard deviation
In a study looking at the effect of stretching on workout satisfaction, what would an effect size of d = 0.45 tell us?
Stretching has a medium effect on workout satisfaction
The most common alpha level used in psychology is…
0.05
Is a p-value of .012 significant at out alpha level?
Yes
T/F If an effect is significant, that means it must be large.
False
In a one-tailed test:
The critical region is on one end
What does increasing sample size do?
Improves reliability findings