[27] Graphs, Spectra & Diagrams
 Call Kai
 Learn
 Practice Test
 Spaced Repetition
 Match
 Flashcards
 Knowt Play
1/196

There's no tags or description
Looks like no tags are added yet.
197 Terms

Img D001: On an EM spectrum chart, which way do frequency and photon energy change as wavelength gets shorter?
Both increase (c = wavelength x frequency, E = h x frequency). Radio has the longest wavelength and lowest energy, gamma rays the shortest wavelength and highest energy.

Img D002: List the EM regions in order from longest to shortest wavelength.
Radio, microwave, infrared, visible, ultraviolet, X-ray, gamma ray.

Img D003: According to the top bar of this chart, which two broad regions reach the ground through the atmosphere?
Visible light and radio waves (the two atmospheric windows). Gamma, X-ray, most UV and most IR are absorbed.

Img D004: What does the thermometer bar at the bottom of this spectrum chart illustrate?
Wien's displacement law: the hotter the object, the shorter the wavelength where its emission peaks (about 100 K peaks in the IR, about 10,000 K near visible/UV).

Img D005: Which curve is the Sun and which is Earth, and why do they peak where they do?
Left curve (peak about 0.5 um) is the Sun (about 5800 K). Right curve (peak about 10 um) is Earth (about 288 K). Wien's law: peak wavelength = 2898 um K / T, so the hotter Sun peaks at a much shorter wavelength.

Img D006: Why can climate scientists treat solar and terrestrial radiation as two separate streams?
Their spectra barely overlap: sunlight is almost all shortwave (below about 4 um) and Earth emission almost all longwave (above about 4 um), so gases can be transparent to one and absorb the other.

Img D007: Two trends appear in this family of blackbody curves as temperature increases. Name both laws.
The peak shifts to shorter wavelength (Wien's displacement law, peak = 2898 um K / T) and the total emitted energy (area) rises as T^4 (Stefan-Boltzmann law).

Img D008: Use Wien's law to find the peak wavelength of a 5800 K Sun and a 255 K Earth.
Sun: 2898/5800 = 0.50 um (visible). Earth: 2898/255 = 11.4 um (thermal IR).

Img D009: Which highlighted curve represents the Sun and which represents Earth?
Yellow 5777 K curve = Sun (peak about 0.5 um, visible). Red 300 K curve = Earth (peak about 10 um, thermal IR).

Img D010: On this log plot the blackbody curves never cross. What does that tell you?
A hotter blackbody emits more radiation than a cooler one at every wavelength, not just at its peak.

Img D011: In this solar spectrum, what is the difference between the yellow and red areas, and what makes the notches?
Yellow is sunlight at the top of the atmosphere, red is what reaches sea level. The notches are absorption bands of gases: O3 in the UV, O2 near 760 nm, and mostly H2O (plus CO2) in the near IR.

Img D012: Which gas removes almost all solar UV below about 300 nm before it reaches the surface?
Ozone (O3) in the stratosphere.
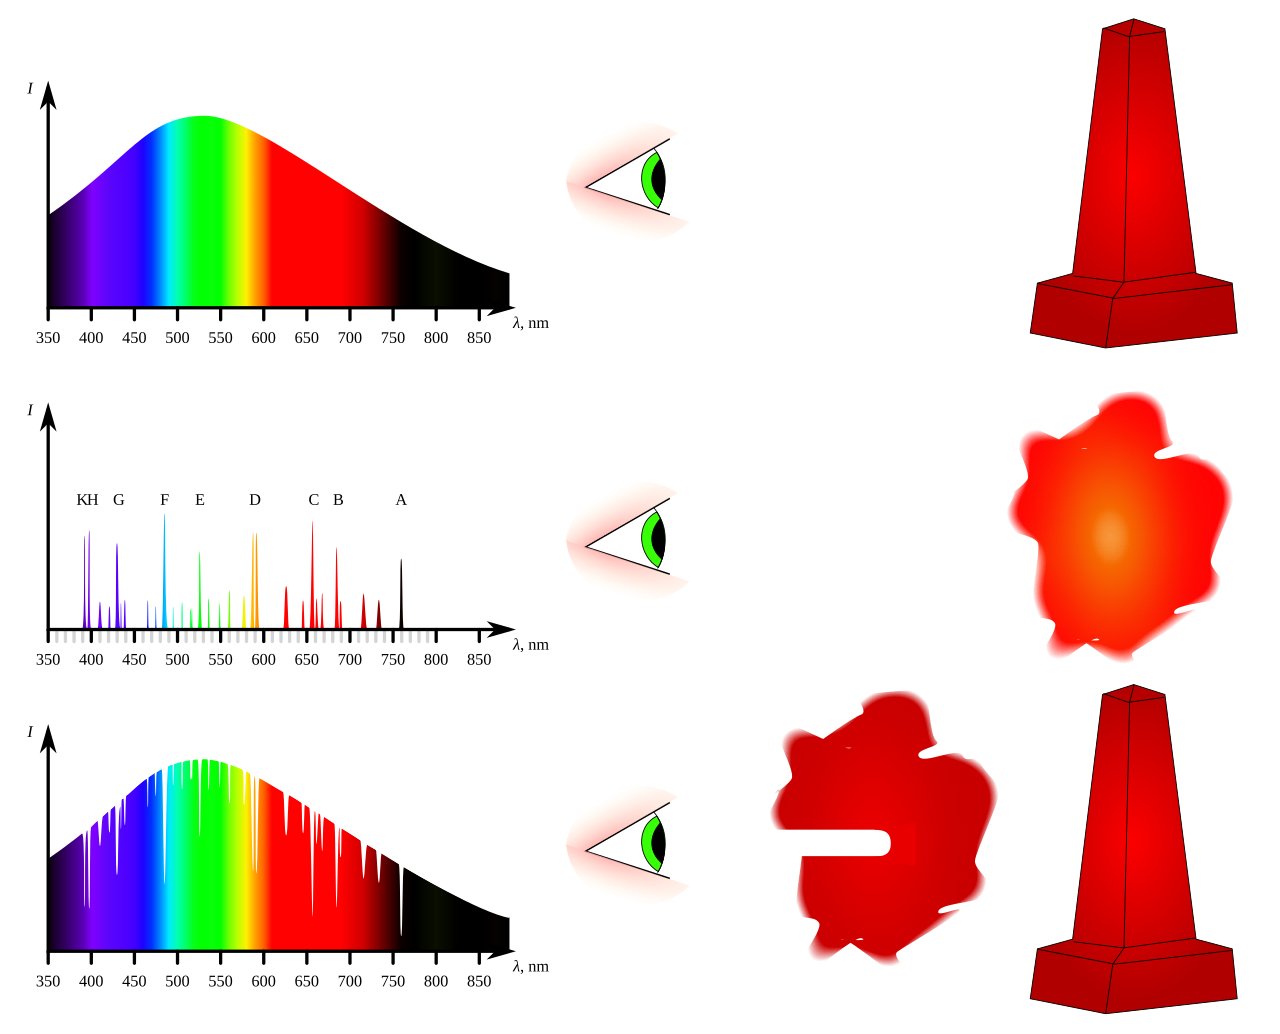
Img D013: Name the three spectrum types in this diagram and the source situation that produces each.
Continuous: hot dense object. Emission (bright line): hot thin gas seen against a dark background. Absorption (dark line): cooler gas in front of a hot continuous source.

Img D014: How is the absorption-line case related to satellite sensing of greenhouse gases?
Gases absorb at the same specific wavelengths where they would emit, so dips in a measured spectrum identify the gas and its amount (e.g., OCO-2 measures CO2 absorption lines in reflected sunlight).

Img D015: Why do the bright lines in the middle strip line up exactly with the dark lines in the bottom strip?
A gas absorbs and emits at the same characteristic wavelengths (energy level differences), so its emission lines and absorption lines coincide.

Img D016: According to the top panel, what fraction of downgoing solar and upgoing thermal radiation gets through the atmosphere, and why does this matter?
About 70 to 75% of sunlight but only 15 to 30% of thermal IR. The atmosphere is mostly transparent to shortwave and mostly opaque to longwave, which is the greenhouse effect.

Img D017: Which gas dominates IR absorption, and which gas absorbs the 15 um band where Earth emits strongly?
Water vapor dominates overall. CO2 absorbs strongly near 15 um (and 4.3 um).
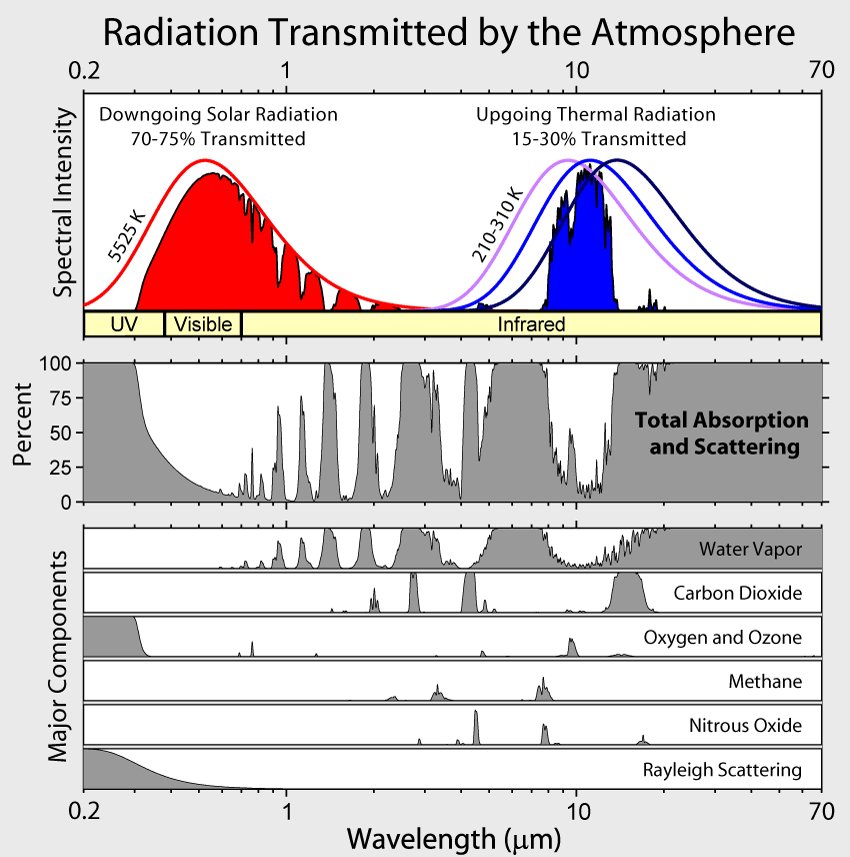
Img D018: Where is the main thermal IR atmospheric window, and which gas has a band inside it?
About 8 to 13 um. Ozone absorbs near 9.6 um inside the window.

Img D019: Name the two major atmospheric windows shown in this opacity plot.
The optical (visible, plus some near IR) window and the radio/microwave window (about 1 cm to 10 m).

Img D020: Why must gamma ray, X-ray and most UV observations be made from satellites?
The atmosphere is nearly 100% opaque at those wavelengths, so the radiation never reaches the ground.

Img D021: Why does adding CO2 still increase the greenhouse effect even though water vapor absorbs much more of the IR?
CO2 absorbs near 15 um, at the edge of the water vapor window where Earth emits strongly and water vapor absorbs less, so it blocks heat that would otherwise escape.

Img D022: What scattering law does this curve show, and what everyday color does it explain?
Rayleigh scattering, proportional to 1/wavelength^4 by molecules much smaller than the wavelength. Blue light scatters much more than red, so the sky is blue.

Img D023: Why is the blue band of a satellite image usually the haziest and lowest contrast?
Rayleigh scattering is strongest at short wavelengths, adding scattered path radiance that washes out the blue band.

Img D024: How does the scattering pattern change as particles get larger relative to the wavelength?
Small particles (Rayleigh) scatter about equally forward and backward. Particles near the wavelength in size (Mie: dust, smoke, pollen) scatter mostly forward.

Img D025: Which scattering type is caused by smoke, dust and pollen, and how does its wavelength dependence compare with Rayleigh?
Mie scattering. It is much less wavelength dependent than Rayleigh and is strongest in the lower atmosphere, giving whitish or brownish haze.

Img D026: Why do clouds appear white (or grey) in true-color satellite images?
Non-selective scattering: cloud droplets are much larger than visible wavelengths, so they scatter blue, green and red about equally, which looks white.

Img D027: In this diagram, what do I, A, T and R stand for and how are they related?
Incident, Absorbed, Transmitted and Reflected energy. I = A + T + R, and the split depends on the wavelength and the target.

Img D028: Which of the A/T/R terms do passive optical sensors such as Landsat OLI mostly measure?
R, the reflected solar energy.

Img D029: Which panel shows specular and which shows diffuse reflection, and what controls the difference?
Left = specular (smooth road, single reflected direction), right = diffuse (rough canopy, scattered in all directions). Whether a surface is smooth or rough is judged against the wavelength.

Img D030: Why does calm water look very dark in a SAR image but rough, wind-blown water looks brighter?
Calm water is a specular reflector that bounces the radar pulse away from the sensor. Waves roughen the surface, scattering some energy back to the radar.

Img D031: Identify the three curves (vegetation, soil, water) and the key feature of each.
Vegetation: low red, sharp rise at about 0.7 um (red edge), high NIR, dips at 1.4 and 1.9 um from leaf water. Soil: gradual rise with wavelength. Water: low, near zero in NIR and SWIR.

Img D032: What is the "red edge" and what causes it?
The steep jump in vegetation reflectance between about 0.68 and 0.75 um: chlorophyll absorbs red strongly, while leaf cell structure reflects NIR strongly.

Img D033: What causes the dips in the vegetation curve near 1.4 and 1.9 um?
Absorption by liquid water in the leaves (and atmospheric water vapor bands at the same wavelengths).

Img D034: Label the parts of this healthy vegetation curve: what controls reflectance in the visible, the NIR and the SWIR?
Visible: leaf pigments (chlorophyll absorbs blue and red). NIR: internal cell structure (high reflectance). SWIR: leaf water content (absorption dips near 1.4 and 1.9 um).

Img D035: How do suspended sediment and phytoplankton change the reflectance of water?
Sediment raises reflectance across the visible (turbid water looks brighter, browner). Chlorophyll adds a green peak and absorbs blue and red. All water is nearly black in the NIR.

Img D036: Snow and clouds are both bright in the visible. Which wavelength region separates them and why?
SWIR near 1.6 um: snow absorbs strongly there (dark) while clouds stay bright. This is the basis of the NDSI snow index.

Img D037: Why does fresh snow have one of the highest albedos of any natural surface, and why does this matter for climate?
It reflects nearly all visible light. When snow and ice melt, darker surfaces absorb more sunlight, causing more warming (ice-albedo feedback).

Img D038: What type of resolution increases from left to right in this figure?
Spectral resolution: one broad band, then a few bands (multispectral), then hundreds of narrow contiguous bands (hyperspectral).

Img D039: Multispectral vs hyperspectral: what is the key difference?
Multispectral has a few (about 3 to 15) broad, separated bands. Hyperspectral has hundreds of narrow, contiguous bands that give a near-continuous spectrum per pixel.

Img D040: Write the NDVI formula and compute it for a pixel with NIR = 0.50 and red = 0.08.
NDVI = (NIR - Red)/(NIR + Red) = (0.50 - 0.08)/(0.50 + 0.08) = 0.72.

Img D041: Why does stressed vegetation have a lower NDVI?
Damaged leaves reflect less NIR (cell structure breaks down) and more red (less chlorophyll absorption), so the difference NIR - Red shrinks.

Img D042: What NDVI values do water, bare soil and dense forest typically have?
Water: negative. Bare soil/rock: near 0 (about 0 to 0.2). Dense green vegetation: about 0.6 to 0.9.

Img D043: Which instrument and channels are shown, and why do forests switch from dark to bright between them?
NOAA AVHRR Channel 1 (red/visible) and Channel 2 (NIR). Chlorophyll absorbs red (dark) while leaf structure reflects NIR (bright). These two channels are used to calculate NDVI.

Img D044: In the NASA energy budget, why is incoming solar radiation 340 W/m2 rather than the solar constant of about 1361 W/m2?
Earth intercepts sunlight over a disk (pi R^2) but spreads it over a sphere (4 pi R^2), so the global average is 1361/4, about 340 W/m2.

Img D045: What is the planetary albedo implied by 99.9 of 340.4 W/m2 reflected?
About 0.29 (99.9 / 340.4).

Img D046: What does "net absorbed 0.6 W/m2" mean?
Earth absorbs slightly more energy than it emits: an energy imbalance that warms the planet, mostly stored in the ocean.

Img D047: Which surface heat loss is larger, thermals (sensible heat) or evapotranspiration (latent heat), and what satellite instrument measures the top-of-atmosphere fluxes in this budget?
Evapotranspiration (latent heat, about 86 W/m2) is much larger than thermals (about 18 W/m2). CERES (Clouds and the Earth's Radiant Energy System) on Terra, Aqua, Suomi NPP and NOAA-20.

Img D048: How can the surface radiate 117% of incoming sunlight without violating energy conservation?
The surface also receives about 100% back radiation from greenhouse gases and clouds, so it absorbs 48% + 100% and loses 117% + 25% + 5% (in balance).

Img D049: In this percent budget, what is the total reflected and total outgoing longwave, and why do they add to 100%?
About 29% reflected shortwave and 71% outgoing longwave. In equilibrium, energy out equals energy in.

Img D050: Of incoming sunlight, roughly what percent is reflected, absorbed by the atmosphere and absorbed by the surface?
About 29% reflected, 23% absorbed in the atmosphere, 48% absorbed at the surface.

Img D051: What are the three ways the surface loses the 48% of sunlight it absorbs, and which is largest?
Evaporation (latent heat, 25%, largest), net thermal IR radiation (17%) and convection/sensible heat (5%).

Img D052: Why does Earth absorb sunlight on only one hemisphere but emit infrared from its whole surface, and what factor does this introduce in the energy balance?
Sunlight is a beam intercepted by Earth's cross-section (pi R^2), while thermal IR leaves the entire sphere (4 pi R^2). That gives the factor of 4: average incoming = S/4 = 1361/4, about 340 W/m2.

Img D053: Which panel is shortwave and which is longwave radiation, and what wavelengths dominate each?
Left (incoming sunlight) = shortwave, mostly 0.2 to 4 um peaking near 0.5 um. Right (outgoing heat) = longwave thermal IR, about 4 to 100 um peaking near 10 um.

Img D054: In this plot, the Sun is labeled about 5500 C and Earth about -20 C. Why does Earth's curve sit about 20 times further to the right?
Wien's law: peak wavelength is inversely proportional to absolute temperature. The Sun (about 5800 K) is about 20 to 23 times hotter than Earth's effective temperature (about 255 K), so its peak wavelength is about 20 times shorter.

Img D055: Check the balance at the top of the atmosphere in this greenhouse diagram.
Absorbed solar 235 W/m2 = thermal out 195 (from atmosphere) + 40 (direct from surface through the window).

Img D056: What do the 324 W/m2 downward arrow and the green loop represent?
Back radiation: greenhouse gases absorb surface IR and re-emit part of it downward, warming the surface to about 14 C instead of about -18 C.

Img D057: Explain the greenhouse effect in two steps using this diagram.
(1) Shortwave sunlight passes through the atmosphere and warms the surface. (2) The surface emits longwave IR, which greenhouse gases absorb and re-emit in all directions, so part returns to the surface and keeps it warmer.
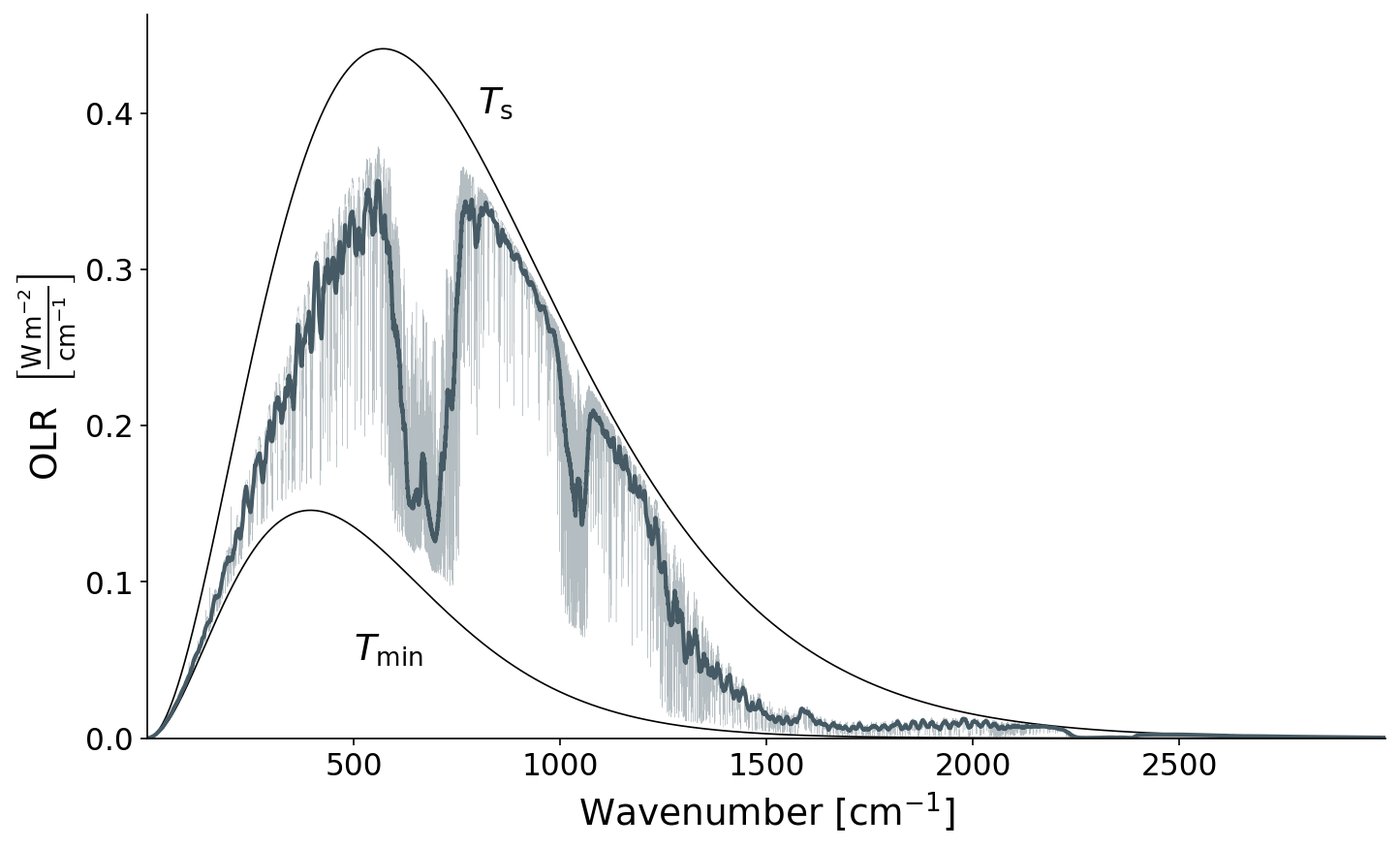
Img D058: Why does the OLR in the CO2 band (about 667 cm-1, 15 um) fall to the Tmin curve?
CO2 is so opaque there that the radiation reaching space is emitted high in the cold upper troposphere/lower stratosphere, near the tropopause temperature, so less energy escapes.

Img D059: Convert 667 cm-1 and 1000 cm-1 to wavelength in um.
Wavelength (um) = 10,000 / wavenumber (cm-1): 667 cm-1 = 15 um, 1000 cm-1 = 10 um.

Img D060: In this OLR spectrum, what does the pink area between the smooth curve and the jagged blue curve represent?
The greenhouse effect: surface IR emission that does not escape to space because greenhouse gases absorb it and re-emit from colder, higher levels.

Img D061: Name the gas responsible for the large dip near 667 cm-1 (15 um) and the smaller dip near 1040 cm-1 (9.6 um).
CO2 for the 15 um dip; ozone (O3) for the 9.6 um dip.

Img D062: If CO2 doubles, how would this OLR spectrum change?
The CO2 bite would widen (its wings extend), emission would come from higher and colder levels, OLR would fall, and the surface would have to warm to restore balance.

Img D063: Why does the Keeling curve zig-zag every year, and when are the high and low points?
Northern Hemisphere vegetation: plants take up CO2 by photosynthesis in spring and summer (minimum about September to October) and decomposition releases CO2 in fall and winter (maximum about May). The NH has much more land and vegetation than the SH.

Img D064: What causes the long-term upward trend, and roughly how much has CO2 risen since 1958?
Burning fossil fuels (plus land-use change). From about 315 ppm in 1958 to over 420 ppm in the mid-2020s, versus about 280 ppm preindustrial.

Img D065: Why is Mauna Loa a good place to measure background CO2?
It is high (about 3,400 m) on a remote Pacific island, far from local pollution and vegetation, so it samples well-mixed air.

Img D066: From this graph, estimate the annual CO2 growth rate at Mauna Loa.
About 2 to 3 ppm per year (the black seasonally corrected line rises from about 416 in 2021 to about 429 in 2026).

Img D067: In which months does Mauna Loa CO2 peak and bottom out?
Peak in May (end of NH winter decomposition), minimum in September to October (end of NH growing season).

Img D068: What gas and units are shown, and what notable feature appears around 1999 to 2006?
Methane (CH4) in ppb. Its concentration leveled off (near-zero growth) from about 1999 to 2006 before rising again from 2007.

Img D069: Why does methane matter so much even though its concentration is about 200 times lower than CO2?
Per molecule it is a much stronger greenhouse gas (about 80 times CO2 over 20 years, about 28 to 30 over 100 years), though it lasts only about a decade in the atmosphere.

Img D070: What is the main human source of rising N2O, and which natural cycle produces it?
Agricultural nitrogen fertilizer (and manure). N2O is a byproduct of microbial nitrification and denitrification in the nitrogen cycle.

Img D071: Besides warming, what other environmental effect does N2O have?
It is now the largest remaining ozone-depleting emission, because N2O breaks down in the stratosphere to NO, which destroys ozone.

Img D072: Why do CFC-11 and CFC-12 decline after their peaks while HFC-134a rises?
The Montreal Protocol (1987) phased out CFC production. CFCs are slowly removed from the atmosphere, and HFCs replaced them (HFCs do not destroy ozone but are greenhouse gases, now limited by the Kigali Amendment).

Img D073: What does an AGGI of 1.56 in 2025 mean?
Radiative forcing from long-lived greenhouse gases is 56% higher than in 1990 (the index year, AGGI = 1).

Img D074: Which gas contributes most of the forcing in this chart, and which is second?
CO2 (about two-thirds), then methane.

Img D075: Which forcing has the largest uncertainty, and is it warming or cooling?
Aerosols (especially the cloud albedo or aerosol-cloud effect). They cause cooling (negative forcing).

Img D076: How does the solar forcing compare with CO2 forcing?
Solar is about 0.12 W/m2, more than 10 times smaller than CO2 (about 1.66 W/m2 in 2005).

Img D077: Roughly how large is total human-caused effective radiative forcing by 2022, and how much do aerosols offset?
About 2.9 W/m2 total. Aerosols contribute about -1 W/m2 (cooling), mostly through aerosol-cloud interactions.

Img D078: Effective radiative forcing vs radiative forcing: what is the difference?
ERF includes rapid atmospheric adjustments (e.g., stratospheric temperature, clouds) that happen before the surface temperature responds. IPCC AR6 uses ERF.

Img D079: Which emission causes the most cooling in this chart and why?
Sulfur dioxide (SO2): it forms sulfate aerosols that reflect sunlight and brighten clouds.

Img D080: Rank the top two warming contributors.
CO2 (about 0.8 deg C), then methane (about 0.5 deg C).

Img D081: What is plotted and why does it matter that six lines agree?
Global mean surface temperature anomaly since 1850. Independent groups using different methods get nearly the same answer, so the warming trend is robust.

Img D082: Why is the record plotted as an "anomaly" rather than absolute temperature?
Anomalies (difference from a baseline average) are much more consistent between nearby stations than absolute temperatures, so they can be averaged reliably across the globe.

Img D083: What causes the short spikes and dips on top of the long-term trend?
Natural variability: El Nino years spike warm (e.g., 1998, 2016, 2023 to 2024), La Nina years and big volcanic eruptions (e.g., Pinatubo 1991) cause temporary cooling.

Img D084: Which satellites produced this record, and what instrument do they carry?
TOPEX/Poseidon (1992), Jason-1, Jason-2 (OSTM) and Jason-3 (now continued by Sentinel-6 Michael Freilich). Each carries a radar altimeter.

Img D085: What are the two main causes of the rising trend?
Thermal expansion of warming seawater and added water from melting land ice (glaciers and the Greenland and Antarctic ice sheets).

Img D086: Why does sea level briefly dip in 2010 to 2011 on this chart?
A strong La Nina moved a lot of water onto the continents as heavy rain (especially Australia and South America), temporarily lowering the ocean, as GRACE also detected.

Img D087: What natural range did CO2 stay within for 800,000 years, and how does today compare?
About 180 to 300 ppm. Today it is above 420 ppm, far outside the natural range.
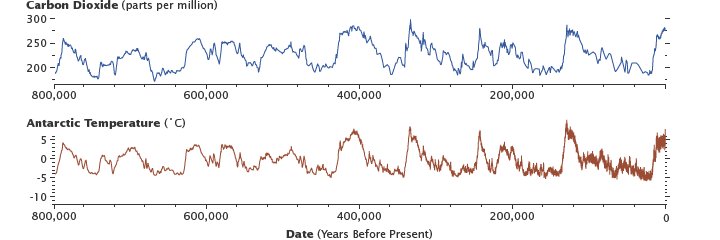
Img D088: What paces the roughly 100,000-year ice age cycles in this record?
Milankovitch cycles (changes in Earth's orbit and tilt), amplified by CO2 and ice-albedo feedbacks.

Img D089: Explain the ice-albedo feedback as a loop.
Warming melts snow and sea ice, exposing darker land or ocean with lower albedo, which absorbs more sunlight, causing more warming and more melting. It is a positive feedback.

Img D090: Why is water vapor a feedback rather than a forcing?
Warmer air holds about 7% more water vapor per deg C (Clausius-Clapeyron). Water vapor rises because of warming (it does not drive the change itself), then amplifies it as a strong greenhouse gas.

Img D091: What is the permafrost carbon feedback?
Warming thaws permafrost, letting microbes decompose old frozen organic matter and release CO2 and methane, which cause more warming (positive feedback).

Img D092: What is the most basic negative feedback in the climate system?
The Planck (radiative) feedback: a warmer Earth emits more infrared radiation (sigma T^4), which cools it.

Img D093: According to this diagram, which positive feedback is strongest, and which feedback involves clouds?
Water vapor is the strongest positive feedback. Changes in cloud cover that trap more radiated heat give a (net positive, uncertain) cloud feedback.

Img D094: Why do warmer oceans take up less CO2?
Gas solubility decreases as water warms, and stronger stratification reduces mixing of surface water into the deep ocean.

Img D095: Of the 9 GtC/yr human emissions in this diagram, how much is taken up by land and ocean, and how much stays in the air?
About 3 GtC/yr extra land uptake and 2 GtC/yr extra ocean uptake, so about 4 GtC/yr (roughly half) accumulates in the atmosphere.
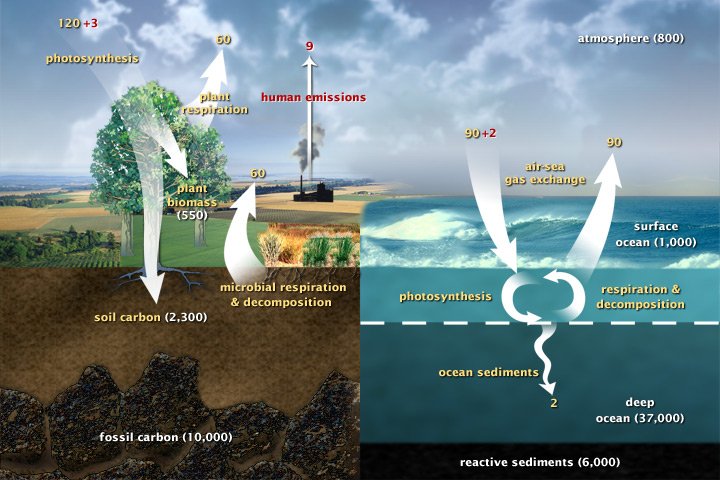
Img D096: Natural fluxes like photosynthesis (120 GtC/yr) are far larger than human emissions (9). Why do human emissions still raise CO2?
Natural fluxes are nearly balanced (photosynthesis about equals respiration and decay). Human emissions are a one-way addition that the sinks only partly absorb.

Img D097: Which reservoir in the fast carbon cycle holds the most carbon?
The deep ocean (about 37,000 GtC), mostly as dissolved inorganic carbon.

Img D098: Name the process for each step: N2 to NH4+, NH4+ to NO2- to NO3-, NO3- to N2.
Nitrogen fixation, nitrification, denitrification.

Img D099: How does the nitrogen cycle connect to climate change?
Nitrification and denitrification release N2O, a long-lived greenhouse gas. Heavy fertilizer use speeds these processes and has raised atmospheric N2O.