Chapter 4-5 [Market Systems + Supply/Demand + Surplus&Efficiency&DWL]
 Call Kai
 Learn
 Practice Test
 Spaced Repetition
 Match
 Flashcards
 Knowt Play
1/16

There's no tags or description
Looks like no tags are added yet.
17 Terms

What curve is this?
Demand

What curve is this?
Supply

What does this represent?
An increase in demand
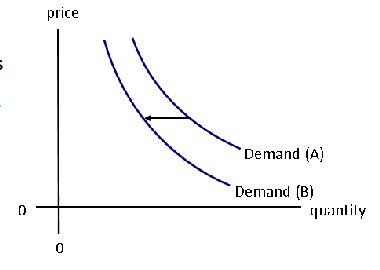
What does this represent?
A decrease in demand

What does this represent?
An increase in supply

What does this represent?
A decrease in supply
What are the horizontal and vertical interpretations of the demand/supply curves?
An increase/decrease is a horizontal shifting to the right/left for both supply and demand
But an increase is a vertical upward shift for demand and a vertical downward shift for supply, while a decrease is a vertical downward shift for demand and a vertical upward shift for supply

What does this represent? Why?
An excess of supply. At that price ($50), supply greatly exceeds demand

…And would there be excess supply or demand at a price of $20.00?
C
Excess demand

An increase in the price of pork

Cause a supply surplus of 72

DWL is area f + g at 3850 units traded

Total consumers’ surplus is equal to area (a) + (b) + (f)

DWL would be zero

Buyer’s reservation price is $26.85 at the 3600th unit and the seller’s reservation price is $10.30 at the 3600th unit

Equal to area (i)

B