Testing Predictors and Evaluating Linear Models
 Call Kai
 Learn
 Practice Test
 Spaced Repetition
 Match
 Flashcards
 Knowt Play
1/23

Earn XP
Description and Tags
Interpreting significance tests for beta coefficients, calculating and interpreting R² and adjusted R² as a measure of model quality, locating information on the significance of individual predictors and overall model fit in R lm model output
24 Terms
What does evaluating a model consist of? When should this evaluation occur?
Evaluating individual coefficients
Evaluating overall model quality
Evaluating model assumptions
Consider these before accepting a set of results
What are the steps in hypothesis testing?
RQ
Stats hypothesis
Define null
Calculate an estimate of effect of interest
Calculate appropriate test stat (+ the p-value associated with this)
Evaluate test stat against the null
What should a research question (statement of what we intend to study) define?
Constructs under study
The association being tested
Direction of association
Target populations etc
What is a statistical hypothesis?
Testable mathematical statement
Null → precis, specifically states that the effect of interest = 0
Can only ever test this hypothesis → p-value = probability of observing test stat or more extreme value, assuming H0 is true
Alternative → non-specific, says effect of interest ≠ 0 (makes no claim about what it might really be equal to)
What is beta?
Gives the predicted change in y for a unit change in x
If x and y are unrelated → (unit) change in x won’t result in any change to the predicted value of y
What test statistic is associated with beta coefficients?
t-statistic

What is the standard error?
Measures how variable the sample is
Smaller SE = more precise estimate = good
What is the code for working out the t-statistic in R?

What distribution does the t-statistic follow when the null hypothesis is true? What does this distribution vary according to?
t-distribution → varies depending on df (related to sample size + number of predictors in linear regression)

What is alpha?
Probability of incorrectly rejecting the null hypothesis, even when it’s true
E.g. 0.05 alpha (2-tailed) = 5% risk of incorrectly rejecting null
When are we more likely to find a statistically significant effect?
When residuals are small + we have a large sample
What do critical values (t*) establish? How does this relate to alpha?
Boundary for significance
The probability that a t-statistic will fall within these extreme regions of the distribution given H0 is true = alpha

What is the code for finding the critical values in R?

t-distribution and critical values example
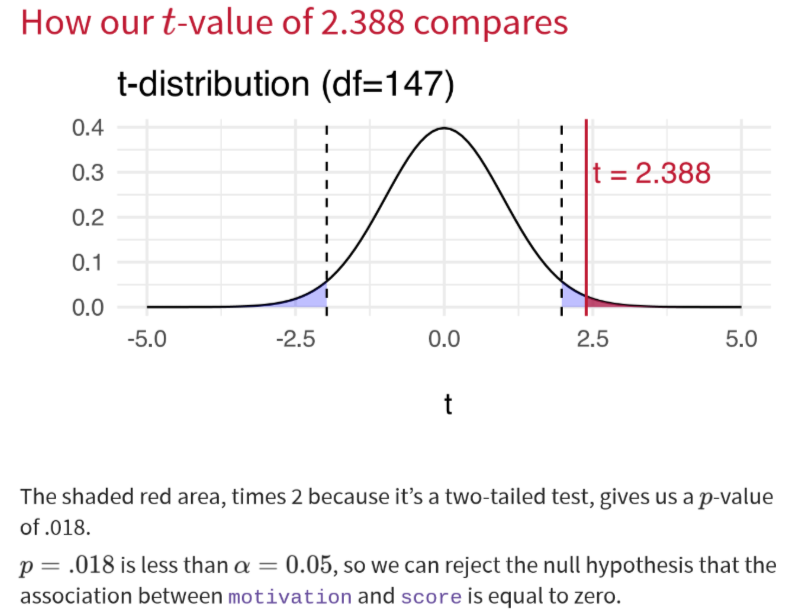
What will occur when we measure an outcome variable y? Why does this happen?
Some variability in that outcome
Hopefully because an IV, x, impacts y
Other variability arises because there is random variability in the world that can’t be accounted for/our model can’t explain
How do we quantify how good our model is? What calculations are associated with this?
Based on what proportion of the variability in our data it can explain
Coefficient of determination = proportion of variability accounted for by the predictors/that the model explains = R²
More variance accounted for = better fit model
E.g. 0.6695 = 66.95% of the variation in y is accounted for by the predictors
Represents the extent to which the prediction of y is improved when predictions are based on the linear relation between x and Y, compared to not considering x

What is the total sum of squares? How is it calculated?
Distance from the mean → for every observation, find the difference between the observed value + the mean of all observed y values → square difference → add up all the squares

What is the residual sum of squares? How is it calculated?
Distance from model → for every observation, find the difference between that observation + the value predicted by the model → square the difference → add up all the square

What is the model sum of squares? How is it calculated?
Distance between model + mean → for every observation, find the difference between the predicted value for that observation + the mean of all observed y values → square difference → add them all up
If all the dots formed a line
Residual = 0
R^2 = 1
Sum of squares = sum squares total

What is R² equal to in R?
lm()’s multiple R-squared

What is the calculation for an adjusted R²?

Why is adjusted R² calculated?
2 or more predictors → R² tends to be an inflated estimate of the corresponding population value
Biased estimate = estimate in stat procedure doesn't accurately correspond to population value
Due to random sampling fluctuation, even when R² = 0 in the population, its value in the sample may ≠ 0
In smaller samples, the fluctuations from 0 will be larger on average
With more predictors, there are more opportunities to add to the positive fluctuation
Adjusted R² gives a more conservative estimate
What does adjusted R² adjust for?
Sample size (n) + number of predictors (k)
Why might R² and adjusted R² be similar?
If the sample size is large + the number of predictors is small → if there were even more predictors, then adjusted R² would be a much more accurate rep of proportion varianc explained